

ENOLOGY / Original research article
Abstract
Saccharomyces cerevisiae is the yeast traditionally used in alcoholic fermentation (AF) in winemaking. After AF, malolactic fermentation (MLF), principally carried out by Oenococcus oeni, converts L-malic acid to L-lactic acid, reducing acidity, increasing pH, and improving microbiological stability.
This study aimed to investigate the effect of adding mannoprotein extracts with varying polysaccharide and protein profiles on MLF performance, as well as on wine phenolic composition and colour stability. The trials were conducted in Tempranillo red wines inoculated with O. oeni PSU-1 during two consecutive vintages (2022 and 2023). To evaluate the feasibility of this practice under cellar conditions, we tested different concentrations: 2 g/L in 2022 and 0.25 and 0.50 g/L in 2023.
Results indicated that adding mannoprotein accelerated MLF kinetics, reducing fermentation duration compared with control wines. MLF improvement could be associated with mannoprotein consumption by O. oeni. Regarding wine quality, mannoprotein addition did not negatively affect pH or volatile acidity but influenced the phenolic profile; specifically, stable acylated anthocyanins and vitisins increased, despite a decrease in total anthocyanins. These findings confirm that low doses (0.25 g/L) of specific mannoprotein extracts can effectively stimulate MLF and modulate pigment composition in red wines.
Introduction
In winemaking, Saccharomyces cerevisiae has traditionally been used for alcoholic fermentation (AF), converting sugars into alcohol and carbon dioxide. After AF, another crucial stage, malolactic fermentation (MLF), often occurs. MLF, driven by lactic acid bacteria, converts L-malic acid into L-lactic acid and carbon dioxide (Pilone & Kunkee, 1970). This process occurs especially in red wine but also in some rosés and highly acidic whites, such as some Chardonnays (Gambetta et al., 2014; Morata et al., 2023; Ruiz-de-Villa et al., 2023). This biotransformation reduces acidity, raises pH, and improves microbiological stability by removing a potential carbon source for spoilage organisms (Liu, 2002; Lonvaud-Funel, 1999; Wibowo et al., 1985). While Oenococcus oeni is adapted to the harsh conditions of wine, its performance can be unpredictable, leading to sluggish or stuck fermentations (Alexandre et al., 2004; Bartowsky, 2005; Liu et al., 2017).
In recent years, mannoproteins have attracted increasing attention; they constitute 30 % to 50 % of the yeast cell wall and enhance both MLF and final wine quality (Klis et al., 2006; Li & Karboune, 2019; Snyman et al., 2021). These glycoproteins are covalently bound to the β-1,3-glucan network and are composed mainly of mannose polymers (> 90 %) and glucose linked to a protein backbone (< 10 %). (Vidal et al., 2003). However, in some cases, the protein content can account for up to 30 % of the structure (Waters et al., 1994).
Although they naturally exist in wine due to release during fermentation and yeast autolysis, their concentration and structural diversity vary significantly depending on the yeast strain, fermentation temperature, and winemaking practices employed (Escot et al., 2001; Gonzalez-Ramos et al., 2008; Llaubères et al., 1987; Ribéreau-Gayon et al., 2006; Snyman et al., 2021; Snyman et al., 2023; Toraño et al., 2025a; Wan et al., 2021).
Beyond their structural definition, the specific oenological role of mannoproteins is closely linked to their extraction method and chemical composition, particularly the polysaccharide-to-protein ratio and molecular weight. Recent studies suggest that these structural differences influence their ability to interact with wine components (Bicca et al., 2022; Toraño et al., 2024). Specifically, in the pH range of wine, mannoproteins are negatively charged, allowing them to establish electrostatic and ionic interactions that affect protein stability, tartrate precipitation, and the stabilisation of phenolic compounds responsible for colour and mouthfeel (Alcalde-Eon et al., 2019; Vernhet et al., 1996; Yue et al., 2021). Furthermore, mannoproteins have been shown to stimulate the growth of lactic acid bacteria (Caridi, 2006; Díez et al., 2010; Guilloux-Benatier et al., 1995; Liu et al., 2017), as well as improving their viability by enriching the wine with nutrients (Alexandre et al., 2004; Balmaseda et al., 2021; Toraño et al., 2025a; Toraño et al., 2025b)
However, most research on the impact of mannoproteins on MLF has been conducted in synthetic wine-like media or using generic yeast extracts, without detailed characterisation of their specific polysaccharide and protein fractions (Toraño et al., 2024). Consequently, there is a gap in knowledge regarding how Mannoproteins extracts with chemically defined and distinct profiles differentially impact O. oeni metabolism in a real wine matrix. Therefore, this study aimed to investigate the effect of mannoproteins extracts, characterised by varying protein and polysaccharide contents, on the performance of MLF conducted by O. oeni PSU-1 in Tempranillo red wines, and to assess their influence on the final wine composition, specifically regarding colour and phenolic parameters. To evaluate the feasibility and interest of this practice under cellar conditions, the study was carried out over two consecutive vintages (2022 and 2023) using different dosage strategies.
Materials and methods
1.1. Microorganism strains and culture media
O. oeni PSU- 1 (ATCC BAA-331) was selected for this study because it is a reference in previous studies and demonstrated significant positive effects on MLF due to mannoprotein addition in a previous screening (Toraño et al., 2024; Toraño et al., 2025a), where it was tested against nine other strains with various mannoprotein extracts in wine-like medium (WLM). The strain was replicated from isolated colonies and cultivated in modified MRS (mMRS) broth (Difco Laboratories, Detroit, MI, USA) defined by Margalef-Català et al. (2017). The medium, adjusted to pH 5, was supplemented with 4 g/L DL-malic acid (Sigma-Aldrich, Barcelona, Spain) and 5 g/L D-fructose (Panreac, Barcelona, Spain). Inocula were prepared from a preculture grown in 50 mL of modified MRS broth until it reached the final phase of exponential growth. The inoculation volume was determined using the O. oeni PSU-1 growth curve, monitored by measuring optical density at 600 nm (OD600). We previously established a correlation between OD600 and viable cell counts (CFU/mL) to calculate the volume required to achieve an initial population of 2 × 10⁶ CFU/mL. The cultures were incubated at 27 °C in a 10 % CO2 atmosphere. O. oeni populations were quantified by plating on modified mMRS plates, which contained 2 % (w/v) agar (Panreac) and were enriched with 100 mL/L of centrifuged tomato juice (Aliada, Madrid, Spain), 100 mg/L of nystatin (Panreac) to inhibit yeast growth, and 25 mg/L of sodium azide (BioSciences, St. Louis MO, USA) to prevent the growth of acetic acid bacteria.
1.2. Mannoprotein extracts
In this work, three commercial mannoprotein extracts were selected for their purity in soluble mannoproteins, between 85 and 95 % richness, from the cell wall of S. cerevisiae species, pH preservation and minimum sulphur dioxide content, which is inhibitory to O. oeni fermentation activity. The products used were Manno PLUS, MP1 (Agrovin, Alcázar de San Juan, Spain); Mannostab, MP2 (Laffort, Bordeaux, France); and Surlì Velvet, MP3 (Enartis, Navarrete, Spain).
The characterisation of the mannoprotein extracts was performed as described in Toraño et al. 2025b. Briefly, the total protein content (w/w) was quantified via the Lowry method (Lowry et al., 1951), employing a DC protein assay kit (Bio-Rad Laboratories Inc., Hercules, CA, USA) and a bovine serum albumin calibration curve. The molecular weight distribution of the mannoproteins was assessed through High-Resolution Size-Exclusion Chromatography (HRSEC-RID) using an Agilent 1260 Infinity system (Agilent Technologies, Palo Alto, CA, USA). An HPLC system equipped with two consecutive Shodex OHpak SB-803 HQ and SB-804 HQ columns (8 mm × 300 mm) (Showa Denko Europe GmbH, Germany) and a refractive index detector (RID) was used. A calibration curve for molecular weight was established using pullulan standards with molecular weights ranging from 342 Da to 805,000 Da.
1.3. Fermentation conditions
All fermentations were conducted using must from Tempranillo grapes (Vitis vinifera L.). The grapes were harvested and processed at the experimental winery Mas dels Frares, located at Universitat Rovira i Virgili of Tarragona (Spain) (41°08′44.1″N, 1°11′51.0″E) in the AOC Tarragona region, during the 2022 and 2023 vintages.
The AF was carried out in a 60 L container kept constantly full by the S. cerevisiae strain Lalvin CLOS, obtained from Lallemand Inc. (Montreal, QC, Canada) at 22 ℃. No nutrient supplementation in the form of added nitrogen or thiamine was used in the fermentations. The initial parameters of grape must were as follows: i) Tempranillo must 2022: density 1102.4 g/L, pH 3.6, titratable acidity 3.75 g tartaric acid/L, 48 mg N/L α-amino nitrogen (NOPA) and 17 mg N/L NH4 and ii) Tempranillo must 2023: density 1.092.4 g/L, pH 3.58, titratable acidity 3.73 g tartaric acid/L, 42 mg N/L α-amino nitrogen (NOPA) and 16 mg N/L NH4. AF was considered complete when glucose and fructose levels fell below 0.4 g/L. Subsequently, after a transfer and a 24-hour stabilisation period, at 4 ℃ the wine was divided into smaller volumes for MLF. Table 1 details the physicochemical characterisation of the wines before the start of MLF.
Wine parameters | Red wine 2022 | Red wine 2023 |
pH | 3.55 | 3.51 |
Titratable acidity (g/L tartaric acid) | 6.10 | 5.60 |
L-malic acid (g/L) | 1.62 | 1.61 |
Glucose/Fructose (g/L) | 0.05 | 0.69 |
Acetic acid (g/L) | 0.22 | 0.12 |
Citric acid (mg/L) | 503 | 326 |
D- lactic acid (g/L) | 0.13 | 0.14 |
L- lactic acid (g/L) | 0.11 | 0.14 |
NH4 (mg N/L) | 22 | 26 |
NOPA (mg N/L) | 28 | 22 |
Mannoproteins (mg of mannose eq./L) | 300 | 346 |
Ethanol (% v/v) | 13.2 | 13.8 |
MLF was conducted in 500 mL sterilised bottles in 2022 and 50 mL tubes in 2023, with O. oeni PSU-1 inoculated to a population of 106 CFU/mL under anaerobic, static conditions. Fermentation vessels were filled to minimise headspace and sealed throughout the experiment, ensuring comparable anaerobic conditions despite the different vessel volumes. Development of the fermentations was monitored daily by measuring the consumption of L-malic acid and following the evolution of the bacterial population. L-malic acid consumption was assessed daily until the concentration fell below 0.1 g/L using the Y15 automated photometric multi-analyser (Biosystems, Barcelona, Spain). At the beginning of fermentation and after MLF, samples from each triplicate were centrifuged and stored at –20 °C. Different concentrations of commercial extracts (0.25 g/L, 0.50 g/L, and 2 g/L) were added over two years.
1.4. Mannoprotein analysis
The determination of mannoproteins followed the method based on Quirós et al. (2011), with some modifications. Five mL of samples were taken after cold precipitation at –20 °C and centrifugation at 4600 × g for 15 min. Five volumes of absolute ethanol were then added to the samples, which were incubated overnight at 4 °C. The samples were subsequently centrifuged at 2800 × g for 10 min. The pellet was washed with two volumes of ethanol, resuspended in 1 mL of ethanol, and transferred to a 2 mL Eppendorf tube. The samples were then centrifuged at 6600 × g for 5 min, and the pellet was dried in a Speedvac vacuum concentrator (Univap 148 100ECH; Progen Scientific, London, UK) for 60 min. The dried samples were hydrolysed by adding 1 mL of 5 M H2SO4 and incubating at 95 °C for one hour in a thermoblock (Labnet, Madrid, Spain). After cooling to room temperature, 1 mL of 1 M NaOH was added (Toraño et al., 2024). The samples for Agilent 1100 HPLC (Agilent Technologies, Germany) were filtered with 0.22 μm pore filters before injection (Agilent Technologies). The HPLC had a Hi-Plex H (300 mm × 7.7 mm) column inside a 1260 MCT (Infinity II Multicolumn Thermostat). The column conditions were 25 °C for 30 min, and the mobile phase was 10 mM H2SO4 and 10 % acetonitrile at a flow rate of 0.6 mL/min. Finally, the chromatograph was equipped with the RID detector at 35 °C (1260 Infinity II refractive index detector) (Agilent Technologies).
1.5. Analysis of wine parameters
Concentrations of sugars (glucose and fructose), L-malic acid, acetic acid, citric acid, tartaric acid, D- and L-lactic acid, NH4+, -amino nitrogen (NOPA), and citric acid were determined with a Y15 automated photometric analyser (Biosystems SA). pH was determined using a Crison micro pH 2002 pH-meter (Crison, Barcelona, Spain) and alcohol contents were determined using ebulliometry (electronic ebulliometer uEBU6576, Gab Sistemática Analítica SL, Barcelona, Spain).
1.6. Colour parameters: anthocyanins and pyranoanthocyanins
CIELab coordinates were determined following the methodology outlined by Ayala et al. (1997). The colorimetric parameters, including hue (H*), lightness (L*), and chroma (C*), were computed using MSCV software (version 4.0, http://www.unizar.es/). The colour intensity (CI) was calculated by summing the absorbances at 420, 520, and 620 nm, measured with a spectrophotometer, using a method described by Glories (1984). According to the chromatic characteristics defined by CIELab (OIV, 2006), the limit for Clarity (L*) ranges from 0 to 100, Tone (Hue, H*) ranges from 0 to 360°, and Chroma (C*) has no specified interval.
Oenological tannin extracts were analysed using the methyl-cellulose precipitation method as detailed by Sarneckis et al. (2006). A fixed volume of 150 µL from each sample was placed in two centrifuge tubes. To tube A, 1 mL of methylcellulose solution (0.4 % w/v) and 1 mL of saturated ammonium sulphate solution were added, and the volume was adjusted to 5 mL. Tube B was similarly prepared, excluding the addition of 1 mL methyl cellulose solution, which was replaced with 1 mL water. After standing at room temperature for 20 min, the samples were centrifuged, and the absorbance of the supernatant was measured at 280 nm using a Helios alpha UV−visible spectrophotometer (Thermo Fisher Scientific Inc., Waltham, MA). The differences in absorbance between the samples were noted. All samples were analysed in triplicate.
This ethanol index establishes the percentage of tannins bound to polysaccharides (non-astringent tannins) as described by Ribéreau-Gayon et al. (2006). It is obtained by measuring absorbance at 280 nm. 1 mL of the sample is mixed with 9 mL of absolute ethanol, homogenised, and allowed to settle overnight at 4 °C. After this period, it is centrifuged (4600 g for 5 min). The supernatant is diluted 1:100 with distilled water, and the absorbance at 280 nm is then measured. Additionally, the absorbance at 280 nm of the original sample diluted 1:100 is determined. The ethanol index is determined by the difference in absorbance measurements in a 1 cm quartz cuvette at time zero (A1) and at the end of the treatment (A2).
The analysis of free and acylated anthocyanins, as well as pyranoanthocyanins, was performed using an Agilent 1200 series liquid chromatograph (HPLC–diode array detection) with an Agilent Zorbax Eclipse XDB-C18 column (4.6, 250 mm × 5 mm, Agilent Technologies). The analytical procedure followed the method outlined by Gil et al. (2012). An external malvidin-3-monoglucoside (Extrasynthèse, Genay, France) calibration curve was employed for the quantification of phenolic compounds in mg/L.
1.7. Statistical analysis
All assays were carried out in triplicate to allow for statistical analysis. ANOVA, Tukey's honestly significant difference (HSD) test (p < 0.05), and a principal component analysis (PCA) were performed to explore sample distribution and visualise associations between mannoprotein consumption, extract concentration, and the resulting oenological parameters. The statistical analyses were performed using the XLSTAT software 2024.3 package (Addinsoft, Paris, France) with a statistical significance level of p < 0.05.
Results and discussion
1. Characteristics of the mannoprotein extracts
In a previous study by the authors, the three commercial mannoprotein extracts MP1, MP2, and MP3 were characterised by their polysaccharide and protein content using high-resolution size-exclusion chromatography (HSREC) (Toraño et al., 2024). MP1 had the highest polysaccharide content (98.1 %) and a significant fraction of medium/high-molecular-weight polysaccharides (74.2 %), as well as a low-molecular-weight fraction (23.1 %). MP2 had a polysaccharide content of 74.5 % and a medium/high-molecular-weight fraction like MP1 (73.9 %), but, in contrast to the others, it lacked a low-molecular-weight fraction. MP3 had the lowest polysaccharide content (71.3 %) and the smallest medium/high-molecular-weight fraction (58.9 %), but it presented a low-molecular-weight fraction of 12.0 %. In terms of protein content, MP3 was the richest with 29 %, followed by MP2 with 26 %, while MP1 had a significantly lower protein content (~2 %). These results obtained through HSREC revealed notable differences in the composition of the three extracts.
2. Effect of mannoprotein addition on MLF
Tempranillo wines produced during the 2022 and 2023 harvests had similar chemical composition (Table 1), and for this reason, they can be considered comparable wines. In the assays of the first harvest in 2022, the chosen concentration for mannoprotein extract addition was 2 g/L, based on previous results in synthetic wine (Toraño et al., 2024) that showed a clear improvement of MLF for some strains, including O. oeni PSU-1. In the second harvest in 2023, the wines were supplemented with 0.25 g/L or 0.5 g/L to meet the recommended use of mannoprotein in wine and make its application more feasible under cellar conditions.
The impact of mannoprotein extracts on the development of MLF varied with the concentration of the extract used (Figure 1), showing positive effects in all cases. Statistical analysis of the 'time to completion' (days to reach < 0.1 g/L L-malic acid) confirmed that this reduction was significant (p < 0.05).
In 2022, wines supplemented with the three MP extracts completed MLF in 14 days, whereas the control took 17 days to finish the fermentation. Although the sampling interval limited temporal resolution, the metabolic difference was chemically evident; for instance, on day 12 in the 2022 vintage, control wines still retained L-malic acid concentrations above 0.2 g/L, whereas MP-treated wines had already completed the process. In 2023, adding MP1 and MP3 at the two evaluated concentrations (0.25 or 0.50 g/L) resulted in a 12-day MLF, 2 days shorter than the control fermentation. Similarly, all MLFs with MP3 addition were shorter than the control, completing in 11 days. The populations of O. oeni PSU-1 were maintained at around 106 CFU/mL at the end of MLF in all the cases; no differences were observed due to mannoprotein addition (data not shown).
The conditions of the wines tested in this study were not particularly stressful for O. oeni (pH > 3.5); therefore, the differences in MLF duration were limited. Besides the relatively high pH (> 3.5), the wines also presented moderate ethanol content, low free SO₂ levels and low volatile acidity, conditions that are generally favourable for O. oeni development. We now explicitly indicate that the positive effect of mannoproteins could be more pronounced under more stressful cellar conditions. Indeed, previous studies have observed the strongest beneficial effects under more challenging MLF conditions (Toraño et al., 2026). In conclusion, adding the evaluated mannoprotein extracts shortened MLF duration, confirming their positive effect on the malolactic performance of O. oeni PSU-1 in Tempranillo red wines across two consecutive vintages.
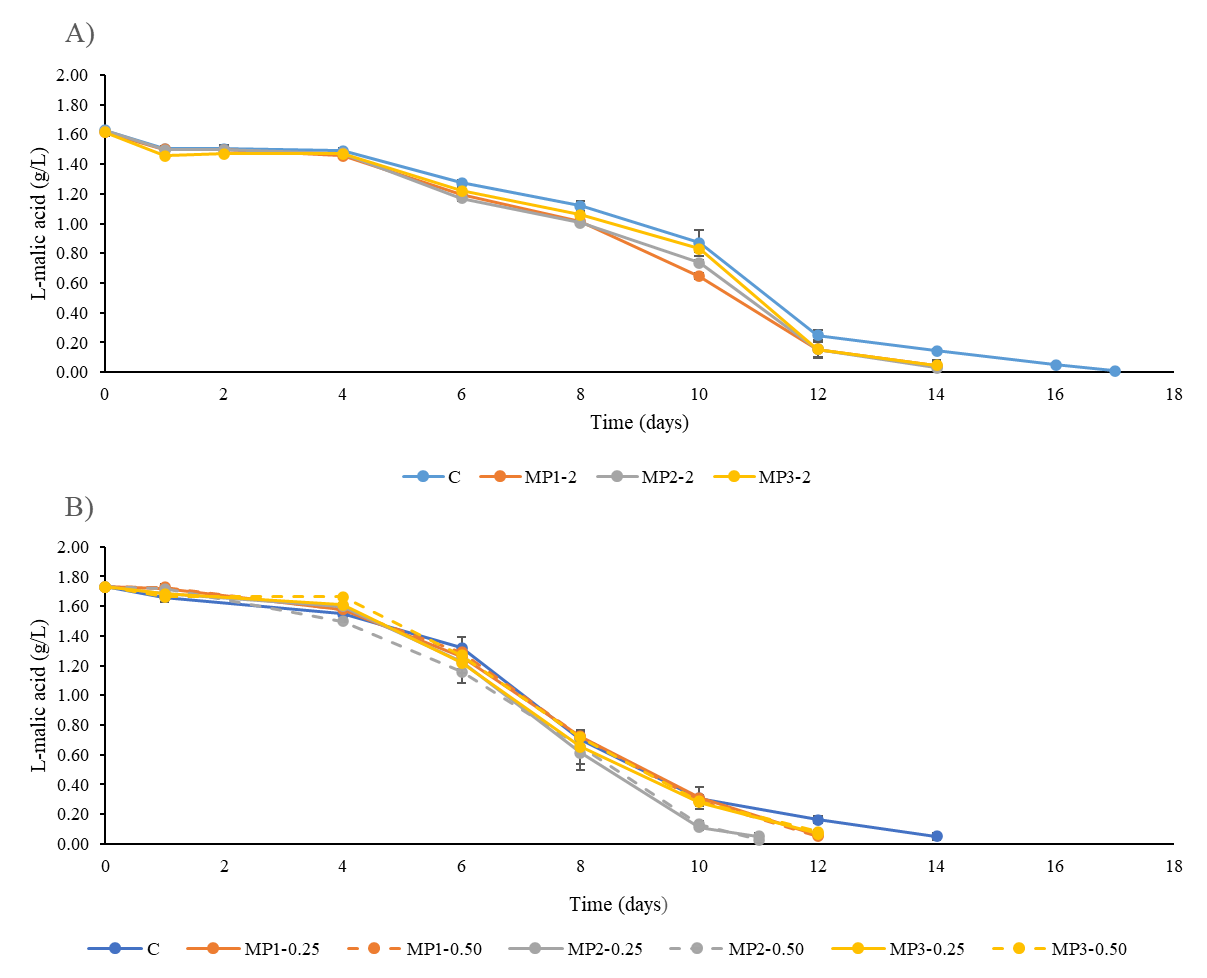
Figure 1. Development of MLF with the addition of commercial mannoprotein extracts (MP1, MP2, and MP3) at A) 2 g/L in Tempranillo red wine from the 2022 harvest and B) 0.5 or 0.25 g/L in red wine from the 2023 harvest with O. oeni PSU-1 strain. Values are presented as the average of three replicates. Vertical bars represent standard deviation (n = 3). Where bars are not visible, the standard deviation is smaller than the data symbol.
3. Mannoproteins consumption during MLF
Consumption of mannoproteins was observed in different proportions under all the studied conditions (Figure 2). The initial concentration of mannoproteins in the wines before extract addition is detailed in Table 1 (Section 1.3).
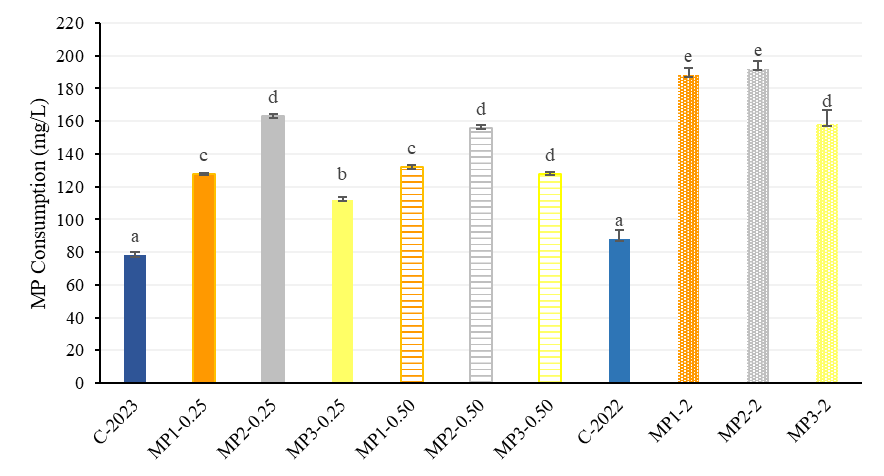
Figure 2. Consumption of mannoproteins (mg/L equivalent of mannose) by O. oeni PSU-1 at the end of MLF in red wine produced during harvests 2022 and 2023. The data are grouped by vintage: the left block corresponds to the 2023 Vintage (Control C-2023 and lower dosages of 0.25 and 0.50 g/L), and the right block corresponds to the 2022 Vintage (Control C-2022 and the high dosage of 2 g/L). Values are presented as the average ± standard deviation of three independent experimental replicates. Different lowercase letters indicate significant differences in MP consumption as determined by the Tukey (HSD) test at p < 0.05.
Upon evaluating the behaviour in both vintages, the control samples from both wines 2022 and 2023 exhibited a similar consumption of mannoproteins at the end of MLF, with values of 88 and 72 mg/L, respectively. Mannoprotein consumption was higher in all fermentations supplemented with mannoprotein extracts. In the two vintages, MP2 showed higher values of consumption by O. oeni PSU-1, being significantly different in vintage 2023 (Figure 2). This aligns with the faster MLF observed in this vintage with MP2 addition (Figure 1B). MP1 and MP3, in this order, showed lower consumption values compared to MP2 in the two evaluated years. The concentration of added mannoprotein extract had some impact on mannoprotein consumption, but it was not always significant. The consumption increased with mannoprotein addition in most cases, except for MP with 0.25 and 0.5 g/L of added mannoprotein extract (slightly lower consumption with 0.5 g/L addition). However, the observed increase in mannoprotein consumption was not proportional to the increase in mannoprotein extract concentration added (Figure 2). The concentration effect was more evident when comparing wines with 2 g/L addition to the rest; however, the differences were not as high as expected based on previous studies with a synthetic wine-like medium (Toraño et al., 2025b). These results indicate that the real wine matrix is much more complex and mannoprotein consumption is not as high as in model laboratory wine, probably due to multiple interferences of other components with mannoproteins, such as phenolic compounds (Bicca et al., 2022; Guadalupe et al., 2008; Manjón et al., 2020; Oyón-Ardoiz et al., 2022; Rodrigues et al., 2012).
The concentration of mannoproteins used by O. oeni PSU-1 in wines supplemented with the three extracts ranged between 112 and 192 mg/L (Figure 2). These values are below the initial mannoprotein concentration detected in wines before extract addition (Table 1), but the detected mannoprotein consumption was always significantly higher in wines supplemented with extracts with respect to the control. This indicates that the addition of mannoproteins to wine stimulates the metabolism of O. oeni PSU-1 and activates the mechanisms that would benefit this bacterium, accelerating MLF. The differences observed among the different extracts in terms of mannoprotein consumption and MLF speed, with MP2 being the extract generating the best results, suggest that the global composition of the extract and the type of mannoprotein (MW and structure) may have a relevant impact on the benefits produced in O. oeni. It has been reported that the yeast strain and the method of mannoprotein extraction may produce differences in the resulting purified mannoprotein characteristics (Manjón et al., 2020; Oyón-Ardoiz et al., 2022; Oyón-Ardoiz et al., 2024; Snyman et al., 2021; Snyman et al., 2023)
Previous studies have shown that adding mannoproteins benefits O. oeni PSU-1 and enhances MLF (Toraño et al., 2024). These studies found that O. oeni may use mannose oligosaccharides released from mannoproteins. Proteomic analysis supported this, revealing increased abundance of proteins involved in carbohydrate transport and metabolism in the presence of mannoproteins (Toraño et al., 2025a).
The addition of 0.25 g/L of mannoprotein extract is sufficient to influence MLF positively. Furthermore, this concentration falls within the recommended range for these additives, according to the OIV.
4. Wine composition at the end of MLF
The composition of oenologically relevant compounds was analysed in wines from the 2022 and 2023 vintages (Table 2), and the initial parameters were described in Table 1. No significant differences were observed in the final pH, meaning that the addition of mannoprotein extracts did not alter this parameter. In 2022 wine, no significant differences were noted in acetic acid levels. However, in the 2023 wine, acetic acid increased compared to the control; although significant, the increase was small (around 0.05 g/L). D-lactic acid increased slightly with the addition of products in both wines, with significant differences particularly noted with the addition of MP2, the most consumed extract. L-lactic acid produced during MLF remained consistent across all conditions, with no significant differences among wines. Regarding citric acid, we observed lower consumption levels with the addition of mannoprotein extracts compared to the controls when 0.5 or 2 g/L of mannoprotein extract was added (Table 2). However, citric acid was consumed more in wines with 0.25 g/L added mannoprotein extract than in the control. However, we did not expect a notable impact on wine quality from this increased citric acid consumption (acetate or diacetyl increase), since it was only around 30 mg/L more than in the control wine. Regarding nitrogenous compounds, both NH4+ and NOPA concentrations increased in most wines supplemented with mannoproteins compared to the control, although this increase was not statistically significant in all cases (Table 2). This could probably be due to the release of amino acids and small peptides from remaining yeast in the process of autolysis (from wine AF) and/or released from the added mannoprotein extracts. Based on these and previous results (Toraño et al., 2024), it could be concluded that O. oeni PSU-1 would mainly use the polysaccharide fraction of mannoproteins, as evidenced by the increases observed here in acetic acid and D-lactic acid, without significantly depleting the available alpha-amino nitrogen pool.
Harvest | MP added (g/L) | MP | pH f | Acetic acid (g/L) | D- Lactic acid (g/L) | L- Lactic acid (g/L) | Citric acid (mg/L) | NH4+ (mg N/L) | NOPA (mg N/L) | |
2022 | Control | - | 3.61 ± 0.01a | 0.36 ± 0.02a | 0.16 ± 0.01a | 1.23 ± 0.03a | 198.33 ± 5.40a | 23.67 ± 7.23b | 26.00 ± 1.00a | |
2 | MP1 | 3.60 ± 0.00a | 0.35 ± 0.01a | 0.17 ± 0.02ab | 1.22 ± 0.02a | 336.00 ± 10.54c | 16.33 ± 0.58a | 39.33 ± 1.53b | ||
2 | MP2 | 3.61 ± 0.01a | 0.37 ± 0.01a | 0.20 ± 0.12b | 1.20 ± 0.02a | 293.33 ± 7.37b | 22.33 ± 1.53ab | 28.33 ± 1.53a | ||
2 | MP3 | 3.61 ± 0.02a | 0.36 ± 0.01a | 0.18 ± 0.01ab | 1.24 ± 0.02a | 335.67 ± 8.33c | 25.67 ± 3.21ab | 45.00 ± 1.00c | ||
2023 | Control | - | 3.57 ± 0.01a | 0.40 ± 0.03a | 0.24 ± 0.01a | 1.24 ± 0.03a | 121.00 ± 2.83b | 36.33 ± 3.79a | 30.00 ± 1.00ab | |
0.25 | MP1 | 3.56 ± 0.02a | 0.45 ± 0.01b | 0.26 ± 0.01ab | 1.19 ± 0.05a | 90.67 ± 6.43a | 40.00. ± 2.64a | 45.33 ± 5.03c | ||
0.25 | MP2 | 3.58 ± 0.01a | 0.46 ± 0.01b | 0.27 ± 0.02b | 1.20 ± 0.04a | 90.33 ± 1.53a | 37.33 ± 6.51ab | 25.00 ± 1.02a | ||
0.25 | MP3 | 3.57 ± 0.01a | 0.49 ± 0.01b | 0.26 ± 0.02ab | 1.21 ± 0.02a | 91.33 ± 4.04a | 33.33 ± 3.21ab | 46.67 ± 6.66c | ||
0.5 | MP1 | 3.58 ± 0.01a | 0.48 ± 0.02b | 0.26 ± 0.01ab | 1.22 ± 0.01a | 114.00 ± 5.03b | 31.67 ± 2.08a | 39.33 ± 3.05bc | ||
0.5 | MP2 | 3.56 ± 0.02a | 0.44 ± 0.01b | 0.27 ± 0.01b | 1.24 ± 0.02a | 118.67 ± 3.03b | 34.00 ± 2.65a | 27.00 ± 2.64b | ||
0.5 | MP3 | 3.55 ± 0.01a | 0.50 ± 0.02b | 0.26 ± 0.02b | 1.20 ± 0.06a | 111.50 ± 4.95b | 36.33 ± 4.04a | 43.33 ± 5.85c | ||
Additionally, a Principal Component Analysis (PCA) was conducted to explore the distribution of samples and visualise the associations between mannoprotein consumption, the concentration of extracts added, and the resulting oenological parameters (Figure 3). The first principal component (PC1) explains 61.67 % of the variance, while the second (PC2) explains 25.57 %, resulting in a combined variance explained by the two components of 89.27 %.
The PCA biplot illustrates the global variance of the experimental data. The first principal component (PC1) primarily separates the two vintages, reflecting a "matrix effect" due to the specific chemical composition of each year. The 2023 wines are positioned on the positive side of PC1, correlating with their naturally higher concentrations of D-lactic acid and acetic acid (Table 2), whereas the 2022 wines cluster on the negative side.
Crucially, despite this vintage separation, each group shows a consistent treatment effect. In both the 2022 and 2023 clusters, the control wines are clearly separated from the mannoprotein-treated wines. Adding extracts (MP1, MP2, MP3) consistently shifts the samples along the vector associated with higher mannoprotein consumption and shorter MLF duration (negative loading on PC1). This confirms that, while the vintage determines the wine's baseline chemical profile, adding mannoprotein extracts accelerates MLF kinetics in both scenarios, demonstrating the robustness of the practice. Therefore, it can be concluded that mannoprotein addition promotes faster MLF development and higher mannoprotein consumption regardless of the initial wine matrix.
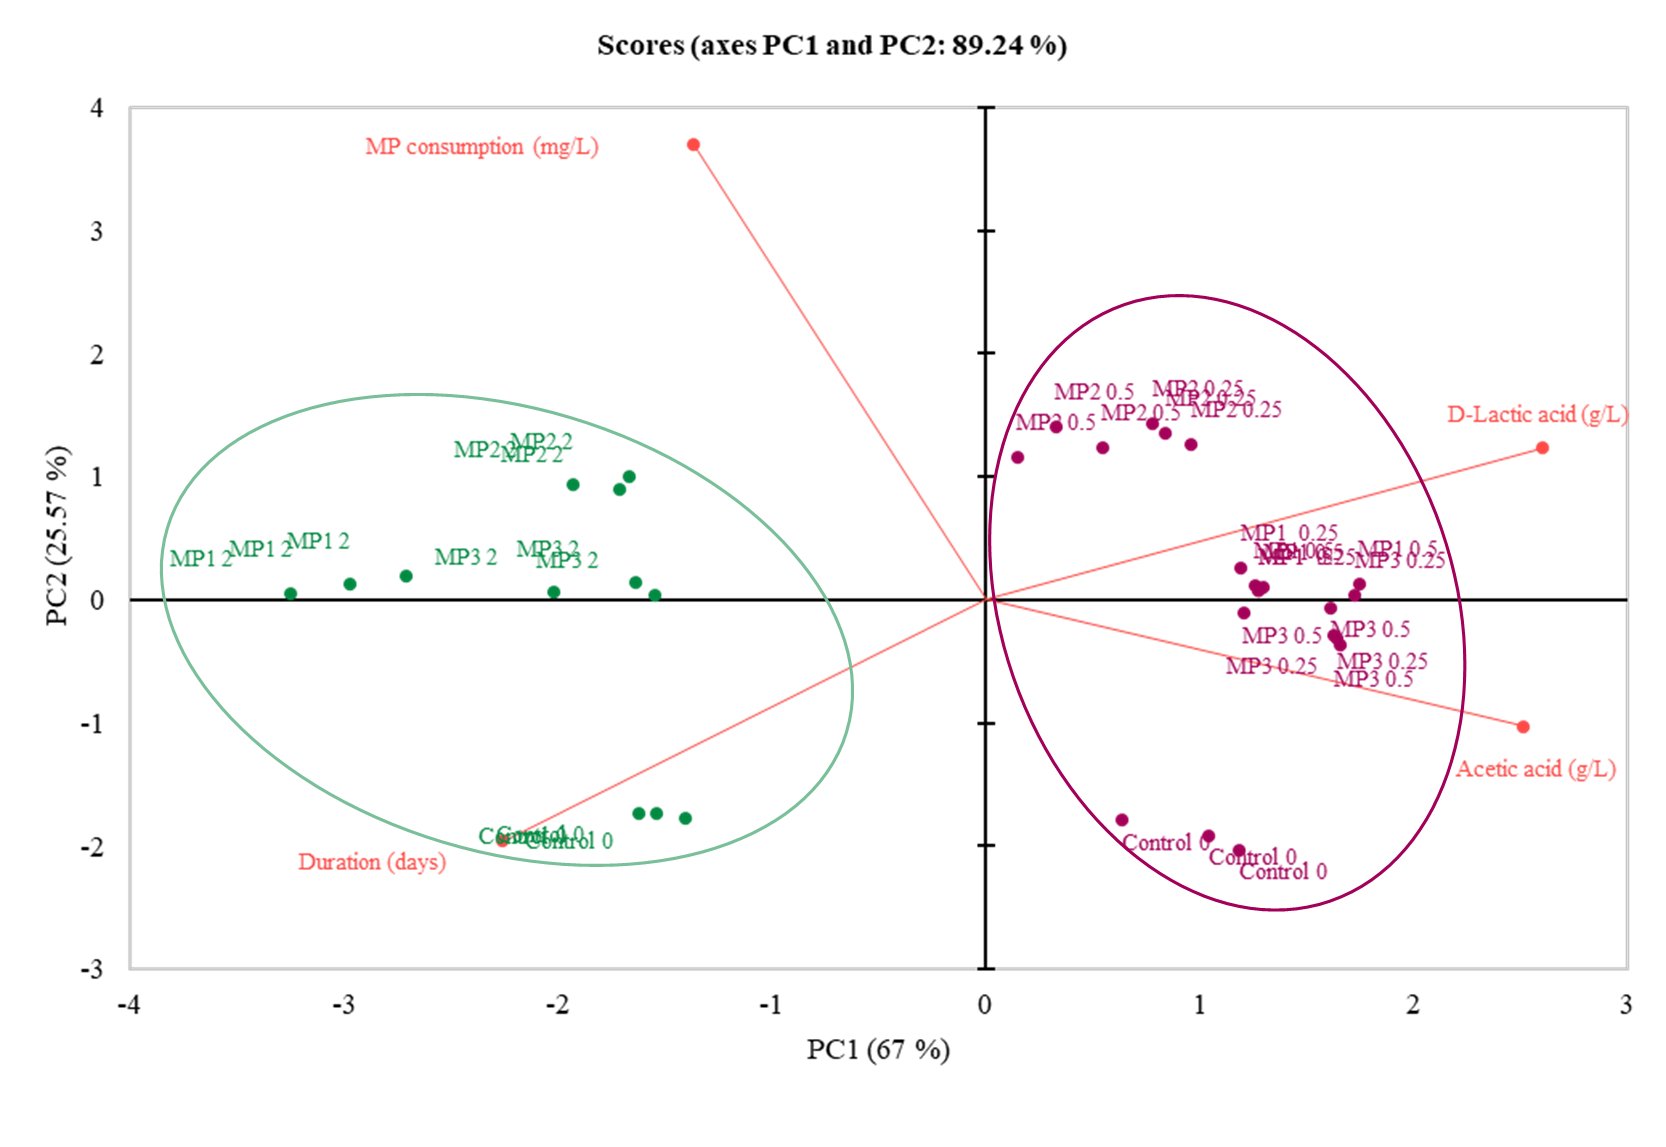
Figure 3. Principal component analysis (PCA) biplot built from the following loadings: duration of MLF, mannoprotein consumption, D-Lactic acid and acetic acid. The scores are as follows: MP1-2, MP2-2, and MP3-2, which correspond to 2 g/L addition of each extract to red wines from the 2022 harvest, and MP1-0.25, MP-0.50, MP2-0.25, MP2-0.50, MP3-0.25, and MP3-0.50, which correspond to 0.25 and 0.50 g/L addition of each extract to red wines from the 2023 harvest. Values are presented as the average of three replicates.
5. Colour parameters, anthocyanins and pyranoanthocyanins
During the 2023 vintage, concentrations of mannoprotein extracts used for wine supplementation were reduced to meet the standard mannoprotein addition currently accepted for other oenological purposes. To evaluate the feasibility of this practice and the possible interference of mannoprotein addition with phenolic compounds, colour parameters, anthocyanins, and pyranoanthocyanins were analysed in wines with the highest mannoprotein concentration of 0.5 g/L. In Figure 4A, the total anthocyanins showed a higher concentration in the control condition, where no mannoprotein extracts were added. However, when the specific types of anthocyanins were analysed separately in Figure 4B, a different trend was observed: the concentration of non-acylated anthocyanins decreased, while the concentration of acylated anthocyanins increased in the samples where mannoprotein extracts were added. A similar trend was observed with pyranoanthocyanins in Figure 4C, where the control condition again showed the highest concentration. When mannoprotein extracts were added, vitisins A and B decreased compared with the control, as shown in Figure 4D.
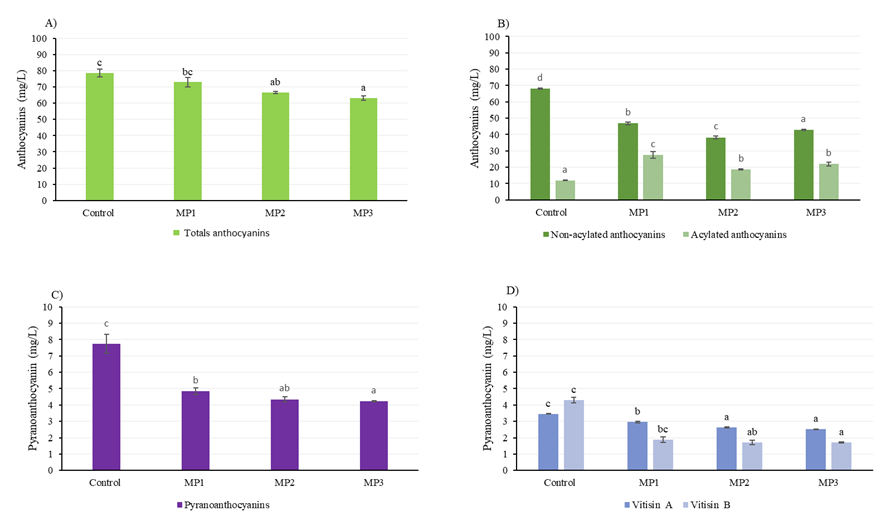
Figure 4. Total anthocyanins (A), non-acylated and acylated anthocyanins (B), total pyranoanthocyanins (C), and vitisin A and vitisin B (D) at the end of malolactic fermentation, expressed as concentration (mg/L). MP1, MP2 and MP3 correspond to the different mannoprotein extracts added at a concentration of 0.5 g/L. The values are expressed as the average ± standard deviation of three biological replicates for each condition. Different lowercase letters indicate significant differences between samples (p < 0.05).
Analysis of colour metrics, total polyphenol index (IPT), and tannins (Table 3) showed no significant differences between conditions. However, the ethanol index increased specifically in samples containing the MP3 extract. This increase may suggest stronger interactions between tannins and these mannoproteins. Adding mannoprotein extracts to wine may increase the concentration of acylated anthocyanins and vitisins because they form more stable complexes with these proteins (Yue et al., 2021). It should be taken into consideration that the commercial extracts used in this study are complex preparations. Therefore, although the observed effects are consistent with differences in mannoprotein composition, a contribution from other co-extracted cell-wall-derived constituents cannot be entirely excluded.
Lightness L* | Chroma C* | Tone H* | CI | Tannins (mg/L) | TPI | Ethanol Index | |
Control | 69.95 ± 1.06a | 30.33 ± 0.87a | 358.13 ± 0.21a | 10.3 ± 0.05a | 2.30 ± 0.24ab | 37.07 ± 3.35a | 15.12 ± 6.83a |
MP1 | 73.45 ± 3.18a | 29.62 ± 3.62a | 358.03 ± 0.42a | 10.8 ± 0.14a | 2.11 ± 0.41ab | 40.10 ± 8.60a | 17.05 ± 6.21a |
MP2 | 70.80 ± 0.42a | 29.80 ± 0.41a | 359.17 ± 0.75a | 10.00 ± 0.02a | 2.38 ± 0.06b | 41.50 ± 1.31a | 26.17 ± 2.07a |
MP3 | 71.75 ± 1.06a | 28.43 ± 1.10a | 358.37 ± 0.57a | 9.50 ± 0.04a | 1.63 ± 0.08a | 37.27 ± 3.97a | 46.89 ± 2.09b |
Guadalupe and Ayestarán (2008) observed a decrease in colour parameters, which differs from the results obtained in this study. Our findings are in accord with those of Rinaldi et al. (2021) and Rodrigues et al. (2012), who observed colour stabilisation after alcoholic fermentation or during long-term contact with mannoproteins. As Guadalupe et al. (2010) observed, anthocyanin and pyranoanthocyanin content varied, suggesting precipitation of mannoprotein-tannin and mannoprotein-pigment co-aggregates.
All the evaluated commercial mannoprotein extracts accelerated MLF in Tempranillo wines inoculated with O. oeni PSU-1, reducing the time required to finish compared to the control. Mannoprotein consumption during MLF varied by extract type and concentration, with MP2 showing the highest consumption across all concentrations. Overall, mannoprotein levels in wine were reduced with extract additions, indicating effective interaction during fermentation. The mannoprotein extracts did not significantly alter wine composition. Nitrogenous compounds increased during MLF in most wines. This suggests that the protein fraction of mannoproteins was not consumed during fermentation and supports the hypothesis that the mannose oligosaccharides released from mannoproteins are the key components used by O. oeni. In the 2023 harvest, control wines had higher anthocyanin and pyranoanthocyanin concentrations compared to those treated with mannoprotein extracts. However, the addition of mannoproteins did not vary the colour parameters, suggesting an imperceptible interaction of phenolic compounds and mannoproteins for 0.25 g/L additions.
The results indicated that the consumption of mannoproteins and the effect on MLF shortening were similar regardless of the concentration of mannoprotein extract added. Therefore, the positive effect of mannoproteins on MLF in red wine was confirmed, as previously reported in a synthetic wine-like medium. Low doses (0.25 g/L) of specific mannoprotein extracts effectively stimulated MLF in Tempranillo red wines inoculated with O. oeni PSU-1. As this concentration is consistent with recommended winery application rates, the results suggest that mannoprotein supplementation may represent a feasible approach to support MLF under cellar conditions. Selecting the appropriate extract type would be crucial for achieving optimal MLF results.
Acknowledgements
This work was supported by grant PID2021-124943OB-I00/ AEI/10.13039/501100011033/ FEDER, UE, awarded by the Spanish Research Agency. PT is grateful for the predoctoral fellowship 2019PMF-PIPF-44 from the Martí Franquès program at Universitat Rovira i Virgili (Tarragona, Spain).
References
- Alcalde-Eon, C., Pérez-Mestre, C., Ferreras-Charro, R., Rivero, F., Heredia, F. J., & Escribano-Bailón, M. (2019). Addition of Mannoproteins and/or Seeds during Winemaking and Their Effects on Pigment Composition and Color Stability. Journal of Agricultural and Food Chemistry, 67(14), 4031–4042. https://doi.org/10.1021/acs.jafc.8b06922
- Alexandre, H., Costello, P. J., Remize, F., Guzzo, J., & Guilloux-Benatier, M. (2004). Saccharomyces cerevisiae-Oenococcus oeni interactions in wine: Current knowledge and perspectives. International Journal of Food Microbiology, 93(2), 141–154. https://doi.org/10.1016/j.ijfoodmicro.2003.10.013
- Ayala, F., Echávarri, J. F., & Negueruela, A. I. (1997). A new simplified Method for measuring the color of wines. i. red and rosé wines. American Journal of Enology and Viticulture, 48(3), 357–363. https://doi.org/10.5344/ajev.1997.48.3.357
- Balmaseda, A., Aniballi, L., Rozès, N., Bordons, A., & Reguant, C. (2021). Use of yeast mannoproteins by Oenococcus oeni during Malolactic fermentation under different oenological conditions. Foods, 10(7), 1540. https://doi.org/10.3390/foods10071540
- Bartowsky, E. J. (2005). Oenococcus oeni and malolactic fermentation – moving into the molecular arena. Australian Journal of Grape and Wine Research, 11(2), 174–187. https://doi.org/10.1111/j.1755-0238.2005.tb00286.x
- Bicca, S., Poncet-Legrand, C., Williams, P., Mekoue Nguela, J., Doco, T., & Vernhet, A. (2022). Structural characteristics of Saccharomyces cerevisiae mannoproteins: Impact of their polysaccharide part. Carbohydrate Polymers, 277, 118758. https://doi.org/10.1016/j.carbpol.2021.118758
- Caridi, A. (2006). Enological functions of parietal yeast mannoproteins. Antonie van Leeuwenhoek, 89(3–4), 417–422. https://doi.org/10.1007/s10482-005-9050-x
- Díez, L., Guadalupe, Z., Ayestarán, B., & Ruiz-Larrea, F. (2010). Effect of yeast mannoproteins and grape polysaccharides on the growth of wine lactic acid and acetic acid bacteria. Journal of Agricultural and Food Chemistry, 58(13), 7731–7739. https://doi.org/10.1021/jf100199n
- Escot, S., Feuillat, M., Dulau, L., & Charpentier, C. (2001). Release of polysaccharides by yeasts and the influence of released polysaccharides on colour stability and wine astringency. Australian Journal of Grape and Wine Research, 7(3), 153–159. https://doi.org/10.1111/j.1755-0238.2001.tb00204.x
- Gambetta, J. M., Bastian, S. E. P., Cozzolino, D., & Jeffery, D. W. (2014). Factors influencing the aroma composition of Chardonnay wines. Journal of Agricultural and Food Chemistry, 62(28), 6512–6534. https://doi.org/10.1021/jf501945s
- Gil, M., Kontoudakis, N., González, E., Esteruelas, M., Fort, F., Canals, J. M., & Zamora, F. (2012). Influence of grape maturity and maceration length on color, polyphenolic composition, and polysaccharide content of Cabernet Sauvignon and Tempranillo Wines. Journal of Agricultural and Food Chemistry, 60(32), 7988–8001. https://doi.org/10.1021/jf302064n
- Glories, Y. (1984). La couleur des vins rouges. 2e partie: Mesure, origine et interprétation. OENO One, 18(4), Article 4. https://doi.org/10.20870/oeno-one.1984.18.4.1744
- Gonzalez-Ramos, D., Cebollero, E., & Gonzalez, R. (2008). A recombinant Saccharomyces cerevisiae strain overproducing mannoproteins stabilizes wine against protein haze. Applied and Environmental Microbiology, 74(17), 5533–5540. https://doi.org/10.1128/AEM.00302-08
- Guadalupe, Z., & Ayestarán, B. (2008). Effect of commercial mannoprotein addition on polysaccharide, polyphenolic, and color composition in red wines. Journal of Agricultural and Food Chemistry, 56(19), 9022–9029. https://doi.org/10.1021/jf801535k
- Guadalupe, Z., Martínez, L., & Ayestarán, B. (2010). Yeast mannoproteins in red winemaking: effect on polysaccharide, polyphenolic, and color composition. American Journal of Enology and Viticulture, 61(2), 191–200. https://doi.org/10.5344/ajev.2010.61.2.191
- Guilloux-Benatier, M., Guerreau, J., & Feuillat, M. (1995). Influence of initial colloid content on yeast macromolecule production and on the metabolism of wine microorganisms. American Journal of Enology and Viticulture, 46(4), 486–492. https://doi.org/10.5344/ajev.1995.46.4.486
- Klis, F. M., Boorsma, A., & De Groot, P. W. J. (2006). Cell wall construction in Saccharomyces cerevisiae. Yeast (Chichester, England), 23(3), 185–202. https://doi.org/10.1002/yea.1349
- Li, J., & Karboune, S. (2019). Characterization of the composition and the techno-functional properties of mannoproteins from Saccharomyces cerevisiae yeast cell walls. Food Chemistry, 297, 124867. https://doi.org/10.1016/j.foodchem.2019.05.141
- Liu, S.-Q. (2002). Malolactic fermentation in wine – beyond deacidification. Journal of Applied Microbiology, 92(4), 589–601. https://doi.org/10.1046/j.1365-2672.2002.01589.x
- Liu, Y., Rousseaux, S., Tourdot-Maréchal, R., Sadoudi, M., Gougeon, R., Schmitt-Kopplin, P., & Alexandre, H. (2017). Wine microbiome: A dynamic world of microbial interactions. Critical Reviews in Food Science and Nutrition, 57(4), 856–873. https://doi.org/10.1080/10408398.2014.983591
- Llaubères, R.-M., Dubourdieu, D., & Villettaz, J.-C. (1987). Exocellular polysaccharides from Saccharomyces in Wine. Journal of the Science of Food and Agriculture, 41(3), 277–286. https://doi.org/10.1002/jsfa.2740410310
- Lonvaud-Funel, A. (1999). Lactic acid bacteria in the quality improvement and depreciation of wine. Antonie Van Leeuwenhoek, 76(1–4), 317–331.
- Lowry, H., Rosebrough, N J., Farr, A. L., & Randall, RoseJ. (1951). Protein measurement with the folin phenol reagent. Journal of Biological Chemistry, 193(1), 265–275. https://doi.org/10.1016/S0021-9258(19)52451-6
- Manjón, E., Brás, N. F., García-Estévez, I., & Escribano-Bailón, M. T. (2020). Cell wall mannoproteins from yeast affect salivary protein–flavanol interactions through different molecular mechanisms. Journal of Agricultural and Food Chemistry, 68(47), 13459–13468. https://doi.org/10.1021/acs.jafc.9b08083
- Margalef-Català, M., Felis, G. E., Reguant, C., Stefanelli, E., Torriani, S., & Bordons, A. (2017). Identification of variable genomic regions related to stress response in Oenococcus oeni. Food Research International (Ottawa, Ont.), 102, 625–638. https://doi.org/10.1016/j.foodres.2017.09.039
- Morata, A., Adell, E., López, C., Palomero, F., Suárez, E., Pedrero, S., Bañuelos, M. A., & González, C. (2023). Use of fumaric acid to inhibit malolactic fermentation in bottled Rioja wines: effect in ph and volatile acidity control. Beverages, 9(1), Article 1. https://doi.org/10.3390/beverages9010016
- OIV. (2006). Determination of chromatic characteristics according to CIELab (Resolution OIV-OENO 1/2006).
- Oyón-Ardoiz, M., Manjón, E., Escribano-Bailón, M. T., & García-Estévez, I. (2022). Effect of mannoproteins from different oenological yeast on pigment composition and color stability of red wine. LWT, 172, 114219. https://doi.org/10.1016/j.lwt.2022.114219
- Oyón-Ardoiz, M., Manjón, E., Escribano-Bailón, M. T., & García-Estévez, I. (2024). Supramolecular study of the interaction between mannoproteins from Torulaspora delbrueckii and flavanols. Food Chemistry, 430, 137044. https://doi.org/10.1016/j.foodchem.2023.137044
- Pilone, G. J., & Kunkee, R. E. (1970). Carbonic acid from decarboxylation by ‘malic’ enzyme in lactic acid bacteria. Journal of Bacteriology, 103(2), 404–409. https://doi.org/10.1128/jb.103.2.404-409.1970
- Quirós, M., Morales, P., Pérez-Través, L., Barcenilla, J.M., González, R. (2011). A new methodology to determine cell wall mannoprotein content and release in wine yeasts. Food Chemistry, 125 (2), 760-766, https://doi.org/10.1016/j.foodchem.2010.08.066
- Ribéreau-Gayon, P., Dubourdieu, D., Donèche, B., & Lonvaud, A. (2006). Handbook of Enology, Volume 1: The Microbiology of Wine and Vinifications. John Wiley & Sons.
- Rinaldi, A., Gonzalez, A., Moio, L., & Gambuti, A. (2021). Commercial mannoproteins Improve the mouthfeel and colour of wines obtained by excessive tannin Extraction. Molecules, 26(14), Article 14. https://doi.org/10.3390/molecules26144133
- Rodrigues, A., Ricardo-Da-Silva, J. M., Lucas, C., & Laureano, O. (2012). Effect of commercial mannoproteins on wine colour and tannins stability. Food Chemistry, 131(3), 907–914. https://doi.org/10.1016/j.foodchem.2011.09.075
- Ruiz-de-Villa, C., Poblet, M., Cordero-Otero, R., Bordons, A., Reguant, C., & Rozès, N. (2023). Screening of Saccharomyces cerevisiae and Torulaspora delbrueckii strains in relation to their effect on malolactic fermentation. Food Microbiology, 112, 104212. https://doi.org/10.1016/j.fm.2022.104212
- Sarneckis, C.J., Dambergs, R.G., Jones, P., Mercurio, M., Herderich, M.J., Smith, P.A. (2006). Quantification of condensed tannins by precipitation with methyl cellulose: development and validation of an optimised tool for grape and wine analysis. Australian J. Grape Wine Res, 12(1), 39–49. https://doi.org/10.1111/j.1755-0238.2006.tb00042.x
- Snyman, C., Mekoue Nguela, J., Sieczkowski, N., Divol, B., & Marangon, M. (2023). Characterization of mannoprotein structural diversity in wine yeast species. Journal of Agricultural and Food Chemistry, 71(49), 19727–19738. https://doi.org/10.1021/acs.jafc.3c05742
- Snyman, C., Mekoue Nguela, J., Sieczkowski, N., Marangon, M., & Divol, B. (2021). Optimised extraction and preliminary characterisation of mannoproteins from non-saccharomyces wine yeasts. Foods, 10(5), 924. https://doi.org/10.3390/foods10050924
- Toraño, P., Balmaseda, A., Bordons, A., Rozès, N., & Reguant, C. (2025a). Proteomic insight into the beneficial effect of mannoproteins on Oenococcus oeni in wine malolactic fermentation. Food Microbiology, 104754. https://doi.org/10.1016/j.fm.2025.104754
- Toraño, P., Gombau, J., Mejías, I., Bordons, A., Rozès, N., & Reguant, C. (2024). Evaluation of the addition of yeast mannoprotein to Oenococcus oeni starter cultures to improve wine malolactic fermentation. Fermentation, 10(1), 52. https://doi.org/10.3390/fermentation10010052
- Toraño, P., Oyón-Ardoiz, M., Manjón, E., A., García-Estévez, I., Bordons, A., Rozès, N., Escribano-Bailón, M.T., & Reguant, C. (2026). Role of mannoproteins in the activation of wine malolactic fermentation: Influence of the yeast and the extraction method. International Journal of Food Microbiology, 454, 111755, https://doi.org/10.1016/j.ijfoodmicro.2026.111755
- Toraño, P., Oyón-Ardoiz, M., Manjón, E., Escribano-Bailón, M.T., Bordons, A., García-Estévez, I., Rozès, N., & Reguant, C. (2025b). Different composition of mannoprotein extracts and their beneficial effects on Oenococcus oeni and wine malolactic fermentation. International Journal of Food Microbiology, 442, 111401, https://doi.org/10.1016/j.ijfoodmicro.2025.111401
- Vernhet, A., Pellerin, P., Prieur, C., Osmianski, J., & Moutounet, M. (1996). Charge properties of some grape and wine polysaccharide and polyphenolic fractions. American Journal of Enology and Viticulture, 47(1), 25–30. https://doi.org/10.5344/ajev.1996.47.1.25
- Vidal, S., Williams, P., Doco, T., Moutounet, M., & Pellerin, P. (2003). The polysaccharides of red wine: Total fractionation and characterization. Carbohydrate Polymers, 54(4), 439–447. https://doi.org/10.1016/S0144-8617(03)00152-8
- Wan, M., Wang, M., Zhao, Y., Deng, H., Tan, C., Lin, S., Kong, Y., Tong, Y., & Meng, X. (2021). Extraction of mannoprotein from Saccharomyces cerevisiae and analysis of its chemical composition and molecular structure. International Journal of Biological Macromolecules, 193(Pt B), 2252–2259. https://doi.org/10.1016/j.ijbiomac.2021.11.057
- Waters, E. J., Pellerin, P., & Brillouet, J.-M. (1994). A Saccharomyces mannoprotein that protects wine from protein haze. Carbohydrate Polymers, 23(3), 185–191. https://doi.org/10.1016/0144-8617(94)90101-5
- Wibowo, D., Eschenbruch, R., Davis, C. R., Fleet, G. H., & Lee, T. H. (1985). Occurrence and growth of lactic acid bacteria in wine: A review. American Journal of Enology and Viticulture, 36(4), 302–313. https://doi.org/10.5344/ajev.1985.36.4.302
- Yue, X., Jing, S., Ni, X., Zhang, K., Fang, Y., Zhang, Z., & Ju, Y. (2021). Anthocyanin and phenolic acids contents influence the color stability and antioxidant capacity of wine treated with mannoprotein. Frontiers in Nutrition, 8. https://www.frontiersin.org/articles/10.3389/fnut.2021.691784
 Views: 194
 XML: 34