

ENOLOGY / Original research article
Abstract
Despite decades of research, wine flavour factors remain poorly explained. We present evidence that L-proline – previously linked to sweetness, viscosity, and flavour intensity – has been an overlooked sensory active compound, with its concentration range across cultivars previously underestimated. Using an automated NMR quantification workflow, we analysed 918 commercial wines (predominantly Australian) across multiple vintages and regions. Proline concentrations varied widely and significantly by variety and style; red wines had a significantly higher mean concentration of 1.53 g/L (range: 0.30–5.55 g/L) compared to white wines at 0.89 g/L (range: 0.17–3.51 g/L). On average, ‘Heavier’ red varieties (Merlot, Cabernet-Sauvignon, Shiraz) and Chardonnay exhibited the highest levels, while ‘lighter’ Gamay, Pinot noir, and Riesling represented the lowest. Standardised sensory testing showed average best-estimate thresholds comparable to that of glucose and fructose, determined at 7.33 g/L (CI: 5.81, 9.25) in model wine, 7.4 g/L (CI: 5.73, 9.50) in Pinot Grigio, 5.9 g/L (CI: 4.71, 7.42) in Chardonnay, 6.1 g/L (CI: 4.67, 7.94) in GSM, and 5.0 g/L (CI: 3.39, 6.61) in Shiraz. Although these average thresholds exceed typical wine averages, they are not absolute detection limits; sensitive participants detected changes < 1 g/L, and ~28 % of participants tested below 3.75 g/L in wine. Exploratory PLS-R modelling of Australian regional climate indices against Cabernet-Sauvignon data suggested tentative associations with solar radiation, evaporation and nighttime minimum temperature for future viticultural testing. This survey highlights variation in residual proline in wines and provides additional evidence that proline can be of sensory significance and is a promising compositional target for measurement and manipulation.
Introduction
The amino acid proline (pyrrolidine-2-carboxylic acid) is the most abundant amino acid found in wine due to its abundance in grapes while being a non-preferred nitrogen source by yeast, as it is not metabolised during fermentation in the absence of oxygen (Huang & Ough, 1991). For this reason, and because of technical challenges with analysing proline by HPLC, it is not often included in routine grape and wine analysis. Although the amino acid content of wine is low from a dietary perspective (Gutiérrez-Gamboa et al., 2019), the accumulation of proline increases dramatically during the final stages of grape ripening (Stines et al., 2000) and, unlike other amino acids consumed during fermentation, remains relatively unchanged in final wines. Due to the abundance of proline, some have sought the use of specialised yeast strains or oxygenation techniques to promote grape proline consumption during fermentation as an alternative nitrogen source and to prevent stuck fermentations and off-odours (Gardner et al., 2002; Ingledew et al., 1987; Long et al., 2018; Omura et al., 2005).
From a viticultural perspective, grape proline levels have been investigated with the general aim of increasing overall amino acid concentration in grapes as a yeast nutrient source (Takagi, 2019) and as known precursors to key aroma compounds (Herraiz & Ough, 1993). Historically, proline has been shown to vary among a limited set of grape cultivars (Huang & Ough, 1991; Ough & Stashak, 1974) and regions (De La Presa-Owens et al., 1995). Although amino acid occurrence in wine has been studied intermittently, as reviewed and compiled by Lehtonen (1996), few comprehensive studies with large sample numbers have investigated proline specifically, likely due to its low priority in yeast nutrition. Hence, little is known about the climatic and other environmental factors associated with proline accumulation.
Despite the past oenological and viticultural practical interest, the possibility of residual proline having a direct wine flavour influence has been surprisingly understudied given its taste threshold of ca. 2 g/L in water, roughly comparable to sucrose (Van Gemert, 2011). Until recently, to our knowledge, only two publications have indicated that proline might have a role in the sweetness of a red wine (Hufnagel & Hofmann, 2008) and the 'body' of some white wines (Skogerson et al., 2009). Building on this earlier work, elevated proline concentration has recently been found to be related to increased sensory panel ratings of red wine viscosity, sweetness and fruit flavour, and decreased bitterness and astringency, which were in turn significantly associated with increased consumer acceptance scores (Espinase Nandorfy et al., 2023). Reflecting these correlational findings, the addition of L-proline to a Shiraz wine low in the amino acid caused similar increases in perceived sweetness, viscosity and fruit flavour ratings, as well as decreased bitterness and astringency (Espinase Nandorfy et al., 2022).
To address the newly revealed sensory importance of proline in wine, we decided to corroborate the sparse data on its concentrations in commercial wines and conducted a large-scale survey and formal sensory threshold testing in various wine styles. Here we primarily aim to assess the concentration range of proline in a broad set of wines of several styles made from different cultivars and from a diverse range of regions, mainly from Australia and to provide standardised sensory threshold values in multiple matrices. Due to the availability of Australian regional wine climatic data, we sought a secondary aim to explore proline-climate index associations. These foundational data enable an assessment of the potential sensory significance of this residual amino acid in wine.
Materials and methods
1. Wine collection for the survey
A convenience sampling approach was used to select 918 wines for analysis across a period of ca. 18 months. Wine samples submitted to a commercial wine-analysis laboratory (Affinity Labs) were sub-sampled for the survey, providing half of the wine samples analysed (53 %), with the other wine samples purchased. The survey was aimed primarily toward an assessment of still red and white table wines that were commercially bottled and labelled. No experimental or unfinished wines were included. Sparkling and rosé wines, and wines made by labelled or known unconventional production methods (‘natural’, ‘hazy’) and novel blends were avoided; however, some values for sparkling wines can be found in Table S1. Conventional blends such as those originating in the Bordeaux and Rhône regions were included, as well as common Australian Cabernet Shiraz blends. All vintages were accepted. These blends also served as a crude validation tool, as mean blend values were expected to fall between blend components.
2. Sampling
Each sample for nuclear magnetic resonance (NMR) spectroscopy analysis was collected from freshly opened bottles by decanting the wine into a 12 mL clear glass vial with no ullage and refrigerated (4 °C) until analysis.
3. Nuclear Magnetic Resonance Spectroscopy
Full experimental details for proline quantitation using 1H NMR are given in (Watson et al., 2025). In brief, to the wine (900 µL), a phosphate buffer (1 M) solution was added containing d4-2,2,3,3-3-(trimethylsilyl)propionic acid (TSP, 5.81 mM) as an internal shift reference, in D2O as an NMR lock solvent. Following buffer addition, the sample was titrated to pH 3.10 ± 0.01 with either NaOH (1M) or HCl (1M) using a BTpH microtitration unit (BrukerBioSpin, Rheinstetten, Germany). The pH-adjusted sample (600 µL) was then transferred to a 5 mm NMR tube (Duran, Economic, 300 MHz, ASIS Scientific, Adelaide, Australia).
NMR experiments were carried out using a 9.4 T magnet (400 MHz 1H frequency) equipped with a 5 mm BBI probe with z-gradients (BrukerBioSpin, Rheinstetten, Germany) at 300 K. Data acquisition and processing were controlled under automation using TopSpin 4.2.0 (BrukerBioSpin, Rheinstetten, Germany). NMR acquisition followed that described by Godelmann et al. (2013). Proline was quantified via the complex multiplet apparent at ~2.35 ppm in the 1D-presat-NOESY spectra using an in-house workflow built in Python 3.10.
4. Other chemical measures
Basic chemical measures (acetic acid, alcohol, glucose and fructose, pH, and titratable acidity) were determined using FT-IR (WineScan™, Foss, Mulgrave, Australia).
5. Collection of Regional Climatic Data
For Australian wines, viticultural climate metrics (Table 1) were determined for the labelled Australian Geographic Indication (GI) (Australian Wine and Brandy Corporation 2008) and vintage year of each wine. Wines that did not come from a single identified GI or were non-vintage wines were discarded. Daily maximum and minimum temperature, rainfall, evaporation, solar radiation, and 0900 h vapour pressure were obtained for each identified GI from the SILO climate database (Jeffrey et al., 2001). Using the data drill tool, which provides point-based time series derived from spatially interpolated grids at a 0.05° resolution across Australia, daily climate data were extracted at the interpolated SILO point closest to the centroid of the relevant GI. Daily data were downloaded for the most recent 20-year period (1 July 2004 to 30 June 2024) to represent the contemporary climate normal, as adopted in similar studies (Hall & Blackman, 2019; Pearson et al., 2021).
The target heat accumulation required to reach maturity in each GI was estimated as 80 % of the mean accumulated GDD10 (1 October to 30 April) in the climate normal 20-year reference period, using a generalised relationship between observed harvest dates and GDD totals in previous Australian grapevine phenology studies (Hall et al., 2016). Phenological stages, specifically budburst and maturity (approximated as the harvest date), were estimated for each GI and growing season of the selected wine dataset using the approach outlined by Hall et al. (2016) (see Figure 1). Budbreak estimation parameters were generalised to a base temperature of 3.5 °C and a target GDD3.5 of 430 °C-days. (averaging Moncur's (1989) parameters across relevant varieties). While other grapevine phenological modelling techniques have been developed, comparison studies (García de Cortázar-Atauri, 2009; Fila et al., 2014; Leolini et al., 2020) suggest that the chosen heat accumulation method is effective, providing the advantage of being practical and consistent to apply to the many GIs included across the geographic range of the study. Having estimated representative budbreak and harvest dates, the climate data were employed to determine a set of key viticultural climate metrics (described in Table 1) for each GI and vintage year combination of the wine dataset.
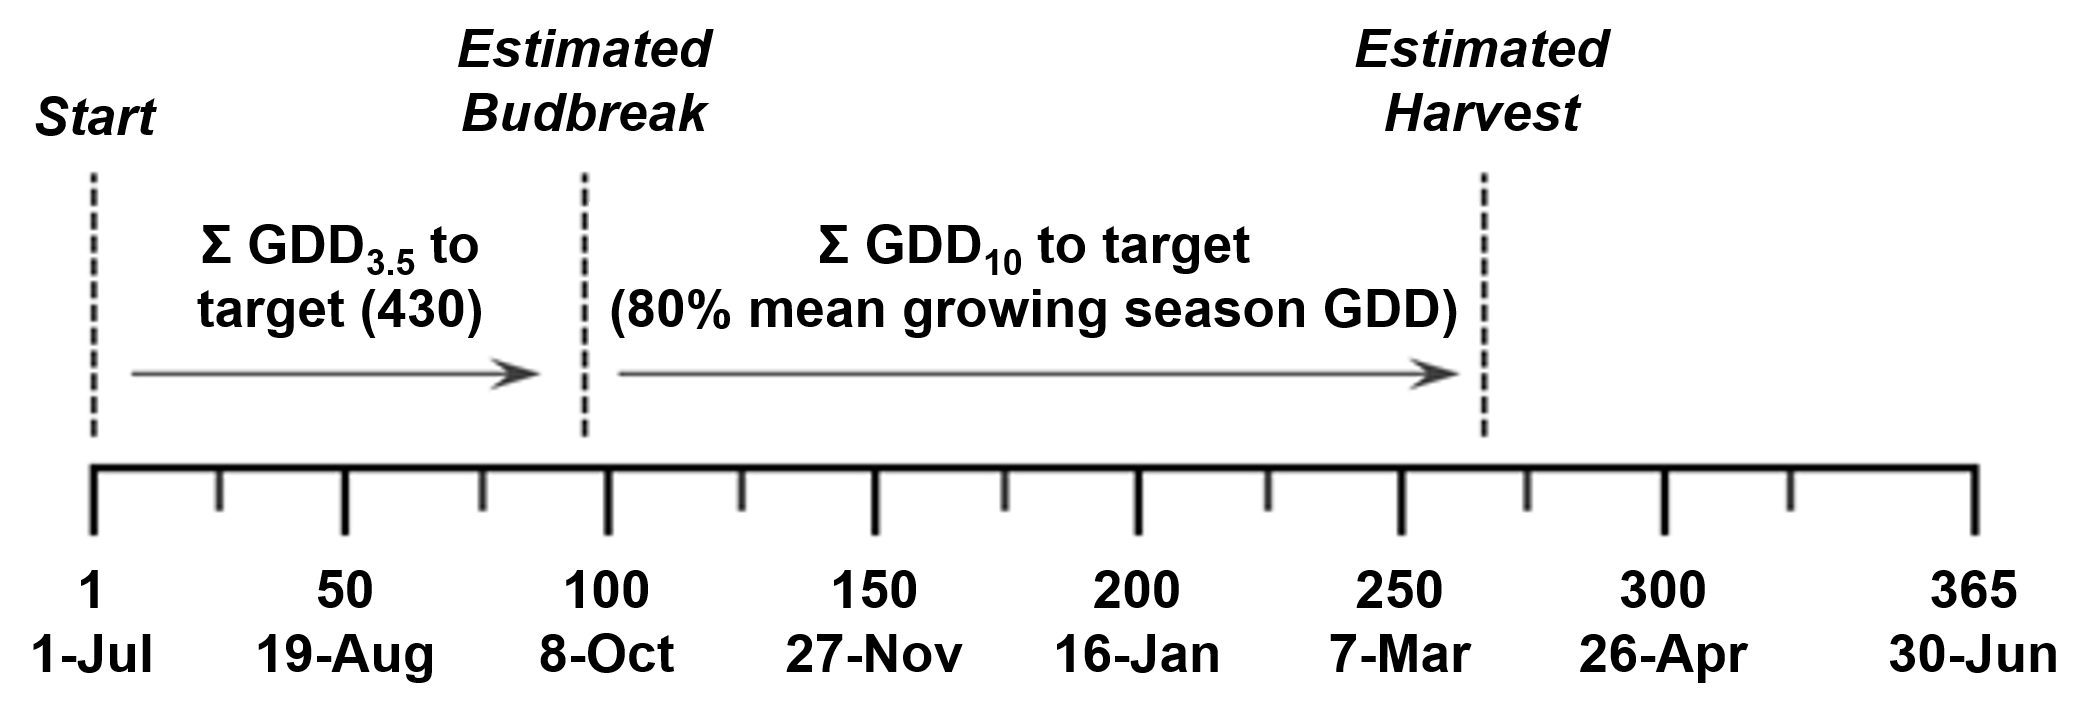
Figure 1. Method to estimate representative budbreak and harvest dates. To estimate budbreak date, GDD3.5 was summed from 1 July until the 430 threshold was met, which for this example GI occurs on Julian day 97, or 5 October. To estimate the harvest date, starting on Julian day 97, GDD10 was summed until the target heat accumulation (80% of the mean GDD from 1 October to 30 April over the last 20 years), which, in this example, occurs on Julian day 267 (24 March).
Metric code | Metric description |
GDD | Total growing degree days from 1 October to 30 April |
GDDph | Growing degree days (phenological), total GDD between estimated budburst and estimated maturity |
Budburst Day | Estimated budburst, days after 30 June |
Harvest Day | Estimated maturity (harvest) date, days after 30 June |
GSTt | Growing season temperature (traditional), i.e., average temperature between 1 October and 30 April |
GSTp | Growing season temperature (phenological), i.e., average temperature between estimated budburst and estimated maturity |
CNIt | Cool night index (traditional), i.e., average minimum temperature of March |
CNIp | Cool night index (phenological), i.e., average minimum temperature of 15 days preceding estimated maturity |
RPTp | Ripening period temperature (phenological), i.e., average temperature of 30 days preceding estimated maturity |
RainGS | Total rain during growing season (mm) |
RainRP | Total rain during ripening period (mm) |
EvapGS | Total evaporation during growing season (mm) |
EvapRP | Total evaporation during ripening period (mm) |
RadnRP | Average solar radiation during ripening period (MJ/m2) |
RadnGS | Average solar radiation during growing season (MJ/m2) |
VPRP | Average vapour pressure during ripening period (hPa) |
RHmaxTRP | Average daily relative humidity at the day's maximum temperature during ripening period (%) |
RHminTRP | Average daily relative humidity at the day's minimum temperature during ripening period (%) |
6. Wines for sensory threshold tests
Four commercial wines were selected from a pool of 36 candidate wines for sensory threshold testing, with the four wines representing both 'lighter' and 'fuller' bodied styles of white and red wines. The selection criteria for the four wines were to be relatively low in proline concentration and residual sugar, have basic chemical measures within normal parameters and be free of off-odours and overt sensory characteristics that may influence the test. Balancing these criteria, a small group of five sensory assessors with technical experience assessed the candidate wines blind and informally deemed them either appropriate or inappropriate for the assessment. The characteristics of the selected wines are detailed in Table 2.
Wine | Region | Vintage | Proline (mg/L) | Alcohol (% v/v) | RS (g/L) | Malic acid (g/L) | pH | TA (g/L) | VA (g/L) |
Pinot Grigio | Adelaide Hills | 2022 | 609 | 12.4 | <0.3 | 1.86 | 3.41 | 5.6 | 0.26 |
Chardonnay | Adelaide Hills | 2022 | 1132 | 12.0 | <0.3 | 1.63 | 3.21 | 7.2 | 0.58 |
GSM | McLaren Vale | 2021 | 1078 | 14.0 | <0.3 | <0.40 | 3.67 | 5.1 | 0.42 |
Shiraz | Coonawarra | 2021 | 1149 | 13.9 | 0.4 | <0.40 | 3.66 | 5.9 | 0.58 |
GSM: Grenache Shiraz Mourvèdre; RS: Residual sugars (glucose and fructose); TA: titratable acidity; pH: 8.2; VA: Volatile acidity as acetic acid
7. Model wine preparation for threshold tests
The model wine solution was prepared as follows by adding 10 % SVR food grade ethanol (CAS 64-17-5, Tarac Technologies, Nuriootpa, SA, Australia) in MilliQ water (Millipore Australia, North Ryde, NSW, Australia) saturated overnight with excess potassium L-tartrate (CAS 868-14-4, Merck, Bayswater, NSW, Australia), then vacuum-filtered using an Air Cadet vacuum station (Barnant, Barrington, Illinois, USA), Nalgene 300-4050 filter unit (Thermo Scientific, Pittsburgh, PA, USA) and Cytiva Whatman™ Quantitative Filter Paper Grade 41 5.5cm circles (Rowe Scientific, Lonsdale, SA, Australia). The solution was adjusted to pH 3.4 with L-tartaric acid (CAS 87-69-4, Merck, Bayswater, NSW, Australia), using a Starter 3100 pH meter (Ohaus Corporation, NJ, USA). The resulting model wine was used as the base solution for proline samples, as well as the no-addition control. A 16 g/L proline (CAS 147-85-3, Merck, Bayswater, NSW, Australia) solution in model wine was prepared, and subsequent serial dilutions were made to yield the samples to be used in the sensory threshold trial (i.e., 0.5, 1, 2, 4, 8, 16 g/L compared to 0 g/L model wine).
8. Sensory threshold tests
This experiment aimed to determine the estimated sensory detection threshold of L-proline in model wine by triangle tests of a 6-level concentration series of limits (ASTM E679 – 19), as well as confirming the sensory difference threshold estimates through adding L-proline to wines containing low amounts of natural proline (Table 2), again according to the same ASTM method (i.e., 0.5, 1, 2, 4, 8, 16 g/L added to the wine and compared to unaltered wine). All samples were made on the morning of each varietal test in 3L batches per level, and all samples, including the control wine, were agitated for 3 min each in sealed bottles. Briefly, sensory evaluations took place in separate tasting booths equipped with daylight fluorescent lighting. Assessors received 30 mL wine samples, maintained at 22–24 °C, poured into standard ISO glasses that were coded with three-digit numbers and covered with 50 mm watch glasses. All wines and model wine samples were presented using a randomised Williams Latin Square design generated via Compusense20 software for triangle testing, where assessors were asked to identify the odd sample out of the three presented. Assessors were selected from the pool of AWRI employees who volunteered to be part of a difference testing panel. All assessors had some experience with difference testing, with various levels of experience at technical or formal sensory evaluations. Twelve participants were also regular assessors for quantitative sensory descriptive panels and were considered highly trained. Details of each panel composition are given in Table 3. Of the total participants, 29 participated in all five assessments, and 40 participated in the tests conducted with commercial wine. The age range of participants in the tests was 22–64 years old.
Matrix | Number of assessors (n) | Mean age of assessors (years) | Genders (% male, % female) | |
Model wine | n = 67 | 43 | 31, 69 | |
Pinot Grigio | n = 65 | 41 | 35, 65 | |
Chardonnay | n = 64 | 43 | 34, 66 | |
Grenache Shiraz Mourvèdre blend | n = 60 | 42 | 35, 65 | |
Shiraz | n = 60 | 43 | 37, 63 |
9. Statistical analysis
Data were cleaned (averaging of duplicate wines) and analysed using XLSTAT (Lumervo, CO, USA). Depending on the outcome of Shapiro–Wilk normality testing, ANOVA with post-hoc Tukey testing or Mann–U Whitney tests were used to test differences across wine, colour, style and region. Climatic data were linked to proline levels using Partial Least Squares Regression (PLS-R) using a NIPALS algorithm with 30,000 iterations, standardisation, cross-validation and significance testing by jack-knifing. Sensory discrimination and difference threshold estimates were calculated using Microsoft Excel according to the ASTM E679 – 19 approach.
10. Ethics statement
Sensory testing involving human participants was performed following ethical standards and received approval from the University of Adelaide Human Research Ethics Committee (Approval ID: H-2022-192).
Results and discussion
1. Commercial wine proline concentrations
For the total survey sample of 918 wines, a wide range of proline concentration values was found, from 0.17–5.55 g/L (median 1.12 g/L). ANOVA was conducted to assess overall differences in proline concentration across varietal wines and blended styles. Of the 30 varietal and style groups with greater than 4 samples, strong evidence (F = 54.3, p < 0.0001) was found supporting a large variation in proline concentration across groups. Detailed descriptive statistics for proline values across single varietals and blends, including those with sample numbers less than four observations (n = 36), can be found in supplementary Table S1. As visualised in Figure 2a, white wines (n = 281), such as Riesling and Semillon, were lowest in mean proline concentration, with Chardonnay and Viognier intermediate to high, and Fiano wines surprisingly high. These varietal differences align with a previous study by (Skogerson et al., 2009) that found, from 17 samples, Sauvignon blanc and Pinot Grigio wine to be low, Viognier intermediate and Chardonnay high in proline concentration, which was well-correlated with a trained panel’s scores of viscous mouthfeel ratings.
A recent associative study in red wine blends also showed higher viscosity sensory ratings of blends with higher proline (Espinase Nandorfy et al., 2023), while evidence from controlled addition experiments also highlighted this mouthfeel effect (Espinase Nandorfy et al., 2022). Earlier work which sampled Californian juices and wines showed Chardonnay to have higher proline concentrations than Sauvignon blanc, while within the red wine samples assessed, Cabernet-Sauvignon had higher levels than Pinot noir (Huang & Ough, 1991). Stines et al. (2000) also found Cabernet-Sauvignon to have higher proline levels than other Australian red and white varietals. For the red wines surveyed in this study (n = 601), Gamay, Grenache, and Pinot noir were found to have the lowest proline concentrations, while Shiraz/Syrah Mataro/Mourvèdre, Rhône blends and certain Italian varieties (Montepulciano, Nero d’Avola, Barbera) were intermediate.
The varieties Cabernet franc, Sangiovese, Durif/Petit Sirah and Nebbiolo had similar mean proline values to the white variety Fiano, and were also considered intermediate to high in concentration. Proline concentration was highest in Cabernet-Sauvignon and Merlot wines and their associated Bordeaux blends, and it was also evident that the distribution became wider, with minimum concentrations in excess of 1000 mg/L. In summary, red wines (Mean = 1534 mg/L, S.D. = 848) were significantly (p < 0.0001) higher in proline on average than white wines (Mean = 890 mg/L, S.D. = 476), as shown in Figure 2b, which also reflects the observations of other reviews (Gutiérrez-Gamboa et al., 2019; Lehtonen, 1996). Histograms and density of red and white wines are available in the supplementary information Figure S1. For the 452 samples where measured alcohol values were available (i.e., not bottle-labelled alcohol), a statistically significant but moderate relationship with proline was found (p < 0.0001, r = 0.424, CI = [0.346, 0.497]). White wines had lower alcohol on average (Mean = 12.6 %, S.D. = 0.72 %) than red wines (Mean = 14.1 %, S.D. = 0.78 %). No evidence was found supporting a relationship between wine proline and price (p = 0.8).
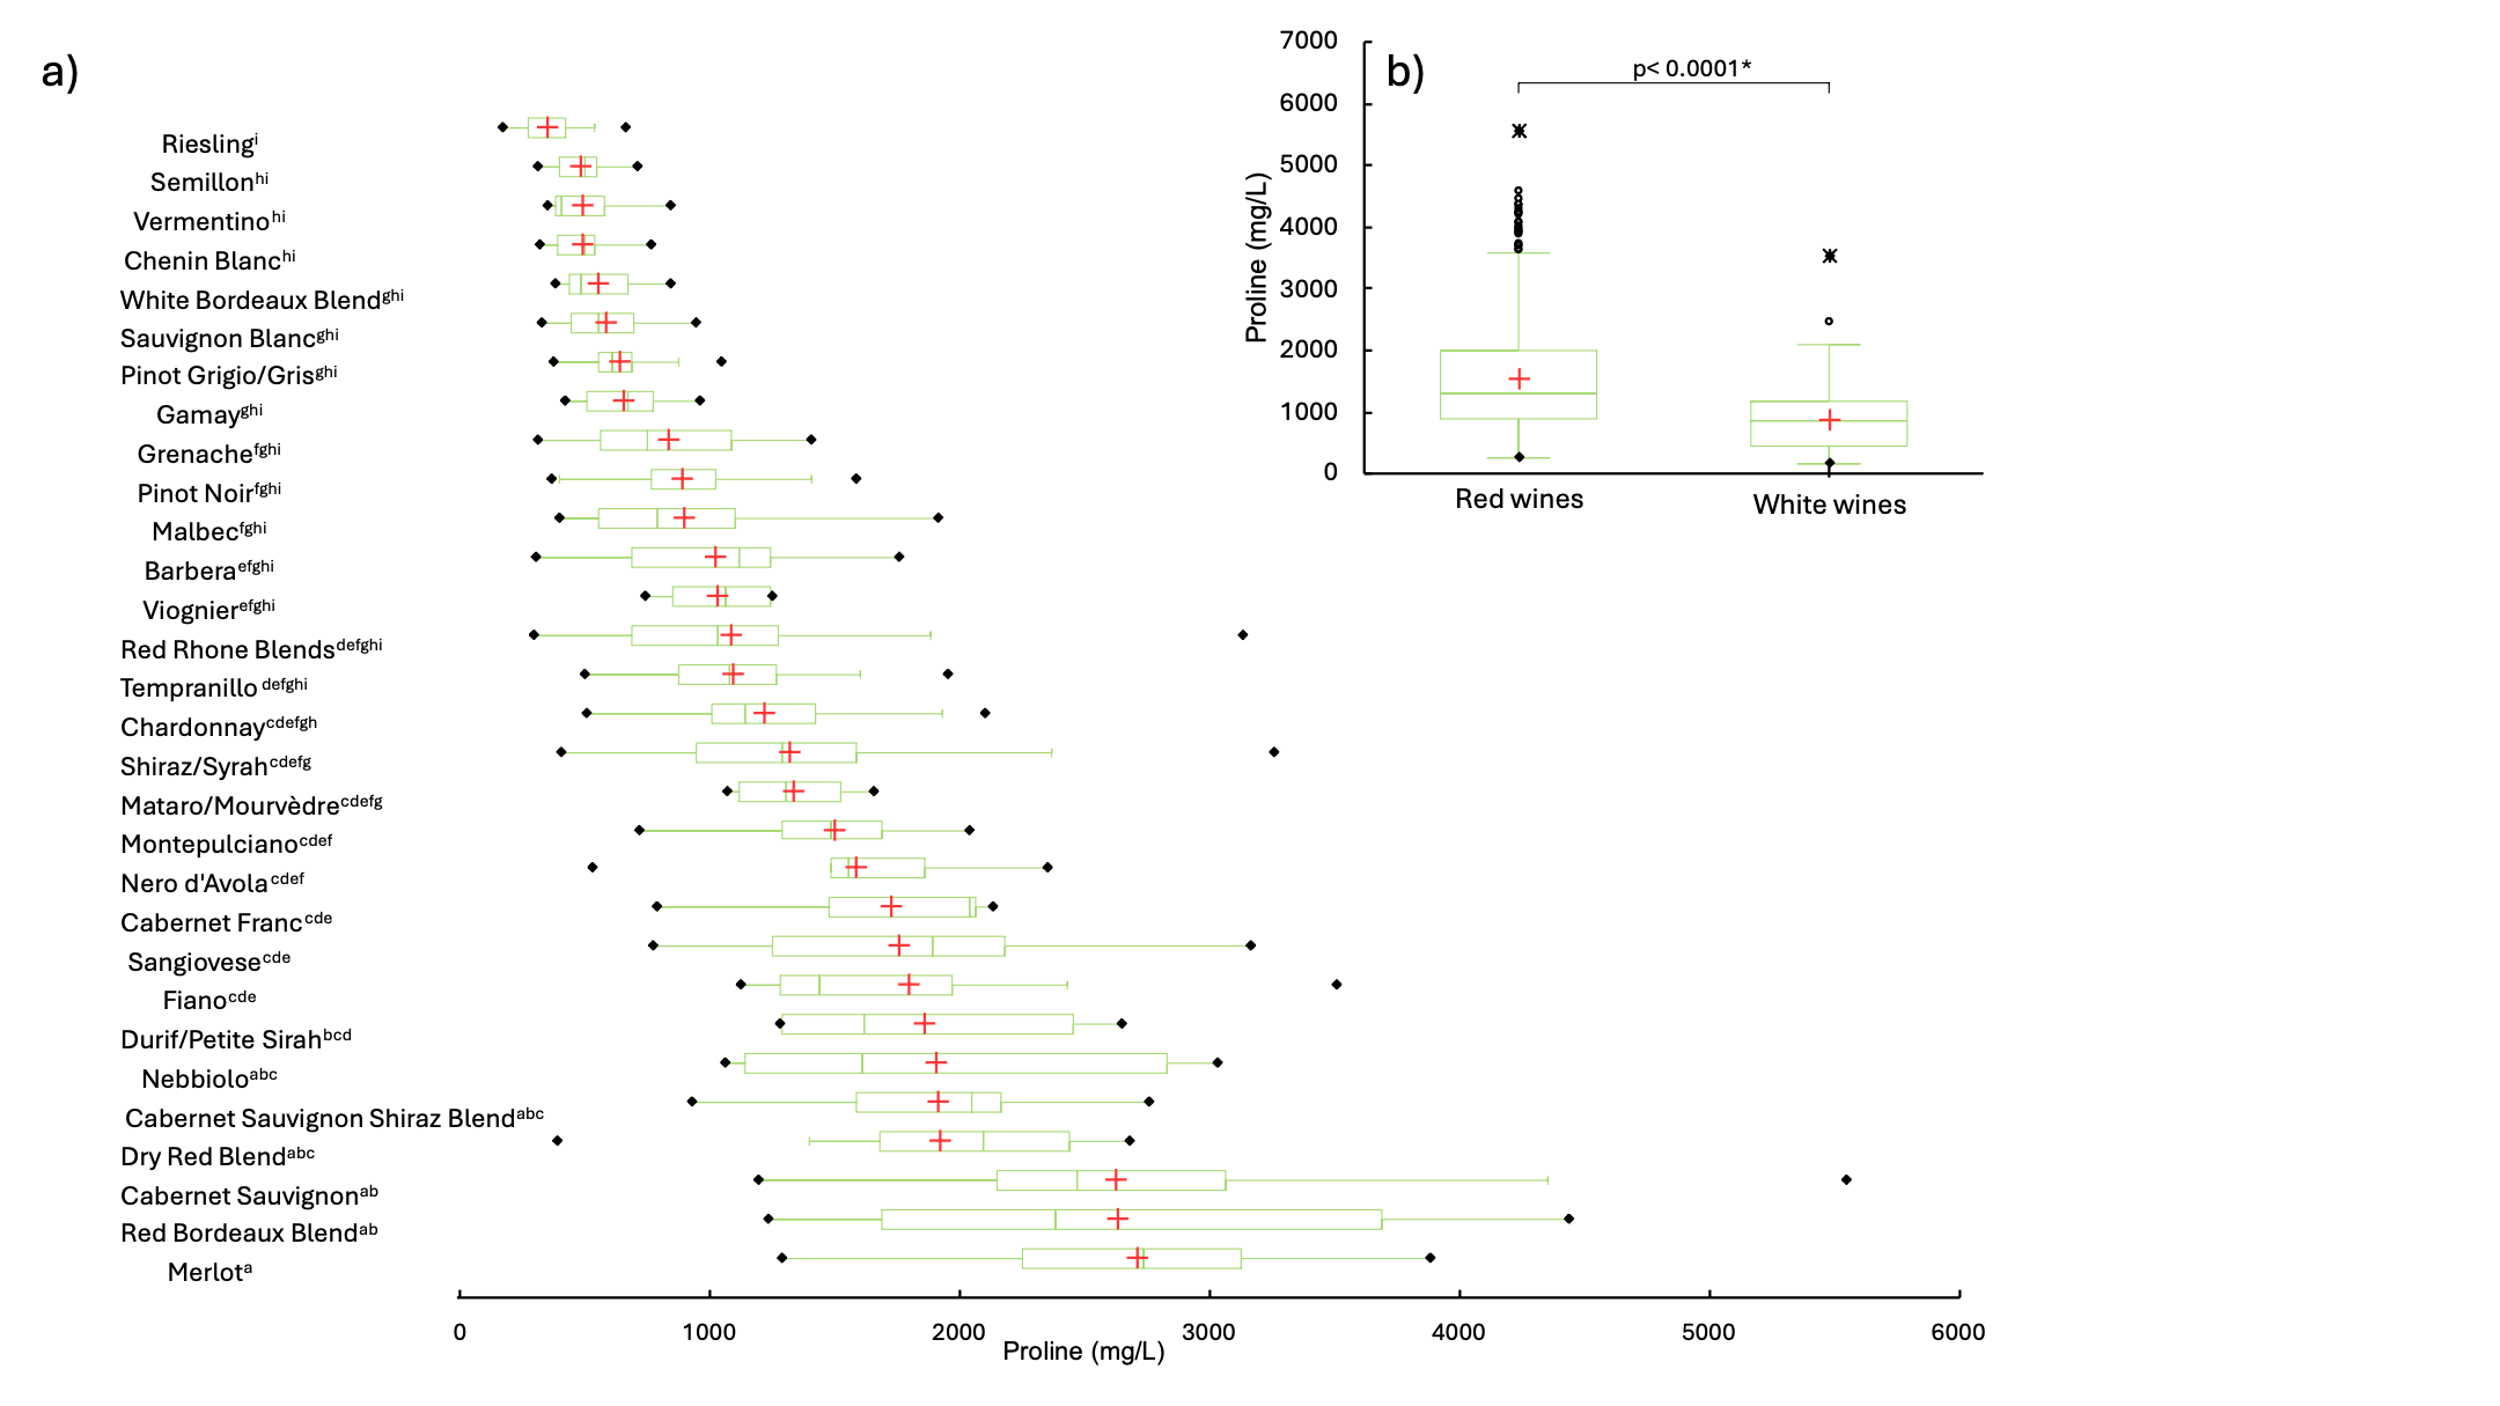
Figure 2. Proline concentration by a) wine variety or style, mean ordered significance by one-way ANOVA (F = 54.34, p = 9.11 × 10-172), Tukey's HSD compact letter display groups (a–i) and b) colour, significance by Mann–Whitney U test. +: Mean value; box and whiskers indicate median, interquartile range, maximum and minimum.
2. Exploring climatic factors associated with Australian Cabernet-Sauvignon wine proline concentration
Acknowledging the inability to draw causal inferences relating regional climate data to proline concentration in commercially produced wine, we explored associational models for this large dataset to guide future controlled viticultural experimentation and provide possible insight into regional wine differences. While predictive models linking climatic factors to proline concentrations performed relatively poorly for most grape varieties, a four-factor PLS-R model specifically for Cabernet-Sauvignon (Figure S1), which had a wide range of 1191–5546 mg/L (Table S1) of proline concentrations, identified tentative environmental associations. Briefly, as can be seen in Supplementary Table 3, proline levels in Cabernet-Sauvignon were significantly and positively associated with higher alcohol concentration (β = 0.32) (a proxy for late-season sugar ripeness), elevated average solar radiation during the growing season (RadnGS; β = 0.17), and higher evaporative demand across the growing season and ripening period (EvapGS; β = 0.16; EvapRP; β = 0.14). Cool night index (CNIp; β = –0.17) was inversely associated with proline levels, with warmer nighttime temperatures during the final ripening period linked to lower proline concentrations and cooler nights before harvest linked to higher proline levels in Australian Cabernet-Sauvignon wines. Caution should be used when interpreting these results since exact locations, harvest dates, possible blending and other oenological manipulations were unknown and may also influence proline levels, proving confounding variables to this exploratory analysis. Beyond climatic factors, soil characteristics play a very important role in grape nitrogen and amino acid content, with factors such as soil organic matter, soil pH, temperature, carbon to nitrogen ratio, humidity, active lime content, soil aeration and water holding capacity all contributing to the total mineral nitrogen available to grapevines (Verdenal et al., 2021).
3. Sensory threshold tests
To estimate the change in concentration needed to detect a sensory difference in wine, as well as the detection threshold in model wine, a series of ascending discrimination tests were used in two white wines, two red wines and model wine. No evidence (F = 1.49, p = 0.219) from the ANOVA of a testing order effect was found for the best-estimate difference threshold values overall, and no evidence of training effect was found for participants common to the wine assessments despite them being conducted on 4 consecutive days (F = 0.43, p = 0.735).
Histograms of each sensory threshold are presented in Figure 3, with the best-estimate detection threshold and 95 % confidence interval for proline added to model wine was (a) x̄= 7.33 g/L (CI = 5.81, 9.25), while the best-estimate difference thresholds (BETs) for each matrix was; (b) Pinot grigio x̄=7.4 g/L (CI = 5.73, 9.50), (c) Chardonnay x̄ = 5.9 g/L (CI = 4.71, 7.42), (d) GSM x̄ = 6.1 g/L (CI = 4.67, 7.94), and (c) Shiraz x̄ = 5.0 g/L (CI 3.39, 6.61). Although these average threshold values appear high, compared with the average proline concentrations measured in the commercial wine survey (Figure 2), these threshold values for proline addition to wine are comparable to those for sweeteners such as sucrose, glucose, and fructose. The detection threshold for sucrose added to white and red wine was reported to be 9 and 8 g/L, respectively (Hinreiner et al., 1955), and 8 g/L for model wine of 10 % ethanol and acid adjusted to pH 3.4 (Berg, 1955). More recently, Blesic et al. (2021) have reported a sweetness threshold range of 3.79–6.07 g/L in white wine using sucrose. In water, L-proline was found to have a detection threshold of 1.51 × 10⁻² M (~1.7g/L), described as “sweet; possibly complex with salty or sour components” (Schiffman et al., 1981). Surprisingly, no detection thresholds for glucose or fructose in wine or model wine are available; however, in water, the taste thresholds for the sweet compounds L-proline, fructose, and glucose were reported to be 2.9 g/L, 1.8 g/L, and 3.2 g/L, respectively (Hufnagel & Hofmann, 2008). Sapid threshold testing in complex matrices beyond water is likely overestimated because of multiple stimuli, and strong carryover effects further complicate evaluation (McBurney & Bartoshuk, 1973). It is important to highlight that published sensory detection thresholds should be interpreted as population-based estimates rather than absolute limits of sensory relevance (Lawless & Heymann, 2010), since trained practitioners (e.g., winemakers and wine industry professionals) and trained panels may perceive meaningful changes at concentrations well below reported thresholds, as supported by quantitative descriptive sensory analysis (QDSA) evidence presented in (Espinase Nandorfy et al., 2022) for proline.
In our study, a small number of individuals, ~3 % on average, who participated in the testing appeared to have no sensitivity up to 30 g/L and possibly beyond, while ~7 % demonstrated high proline sensitivity (< 1.0 g/L), distinguishing the lowest proline addition from the base wine as well as all further additions. Furthermore, ~28 % of participants had individual BET below 3.75 g/L in wine. This level of sensitivity is supported by the evidence from trained panel sensory assessments, indicating that L-proline may influence multiple sensory attributes, notably increasing sweetness, viscosity and enhancing fruit flavour ratings significantly within the range of 0.7 to 3.8 g/L in Shiraz wine (Espinase Nandorfy et al., 2022). Red wine blend proline concentrations have also been associated with increased ratings of the same sensory terms, as well as consumer acceptance scores (Espinase Nandorfy et al., 2023). Similar sensory and consumer responses have been observed for glucose and fructose concentrations (Lattey et al., 2010; Williamson et al., 2012).
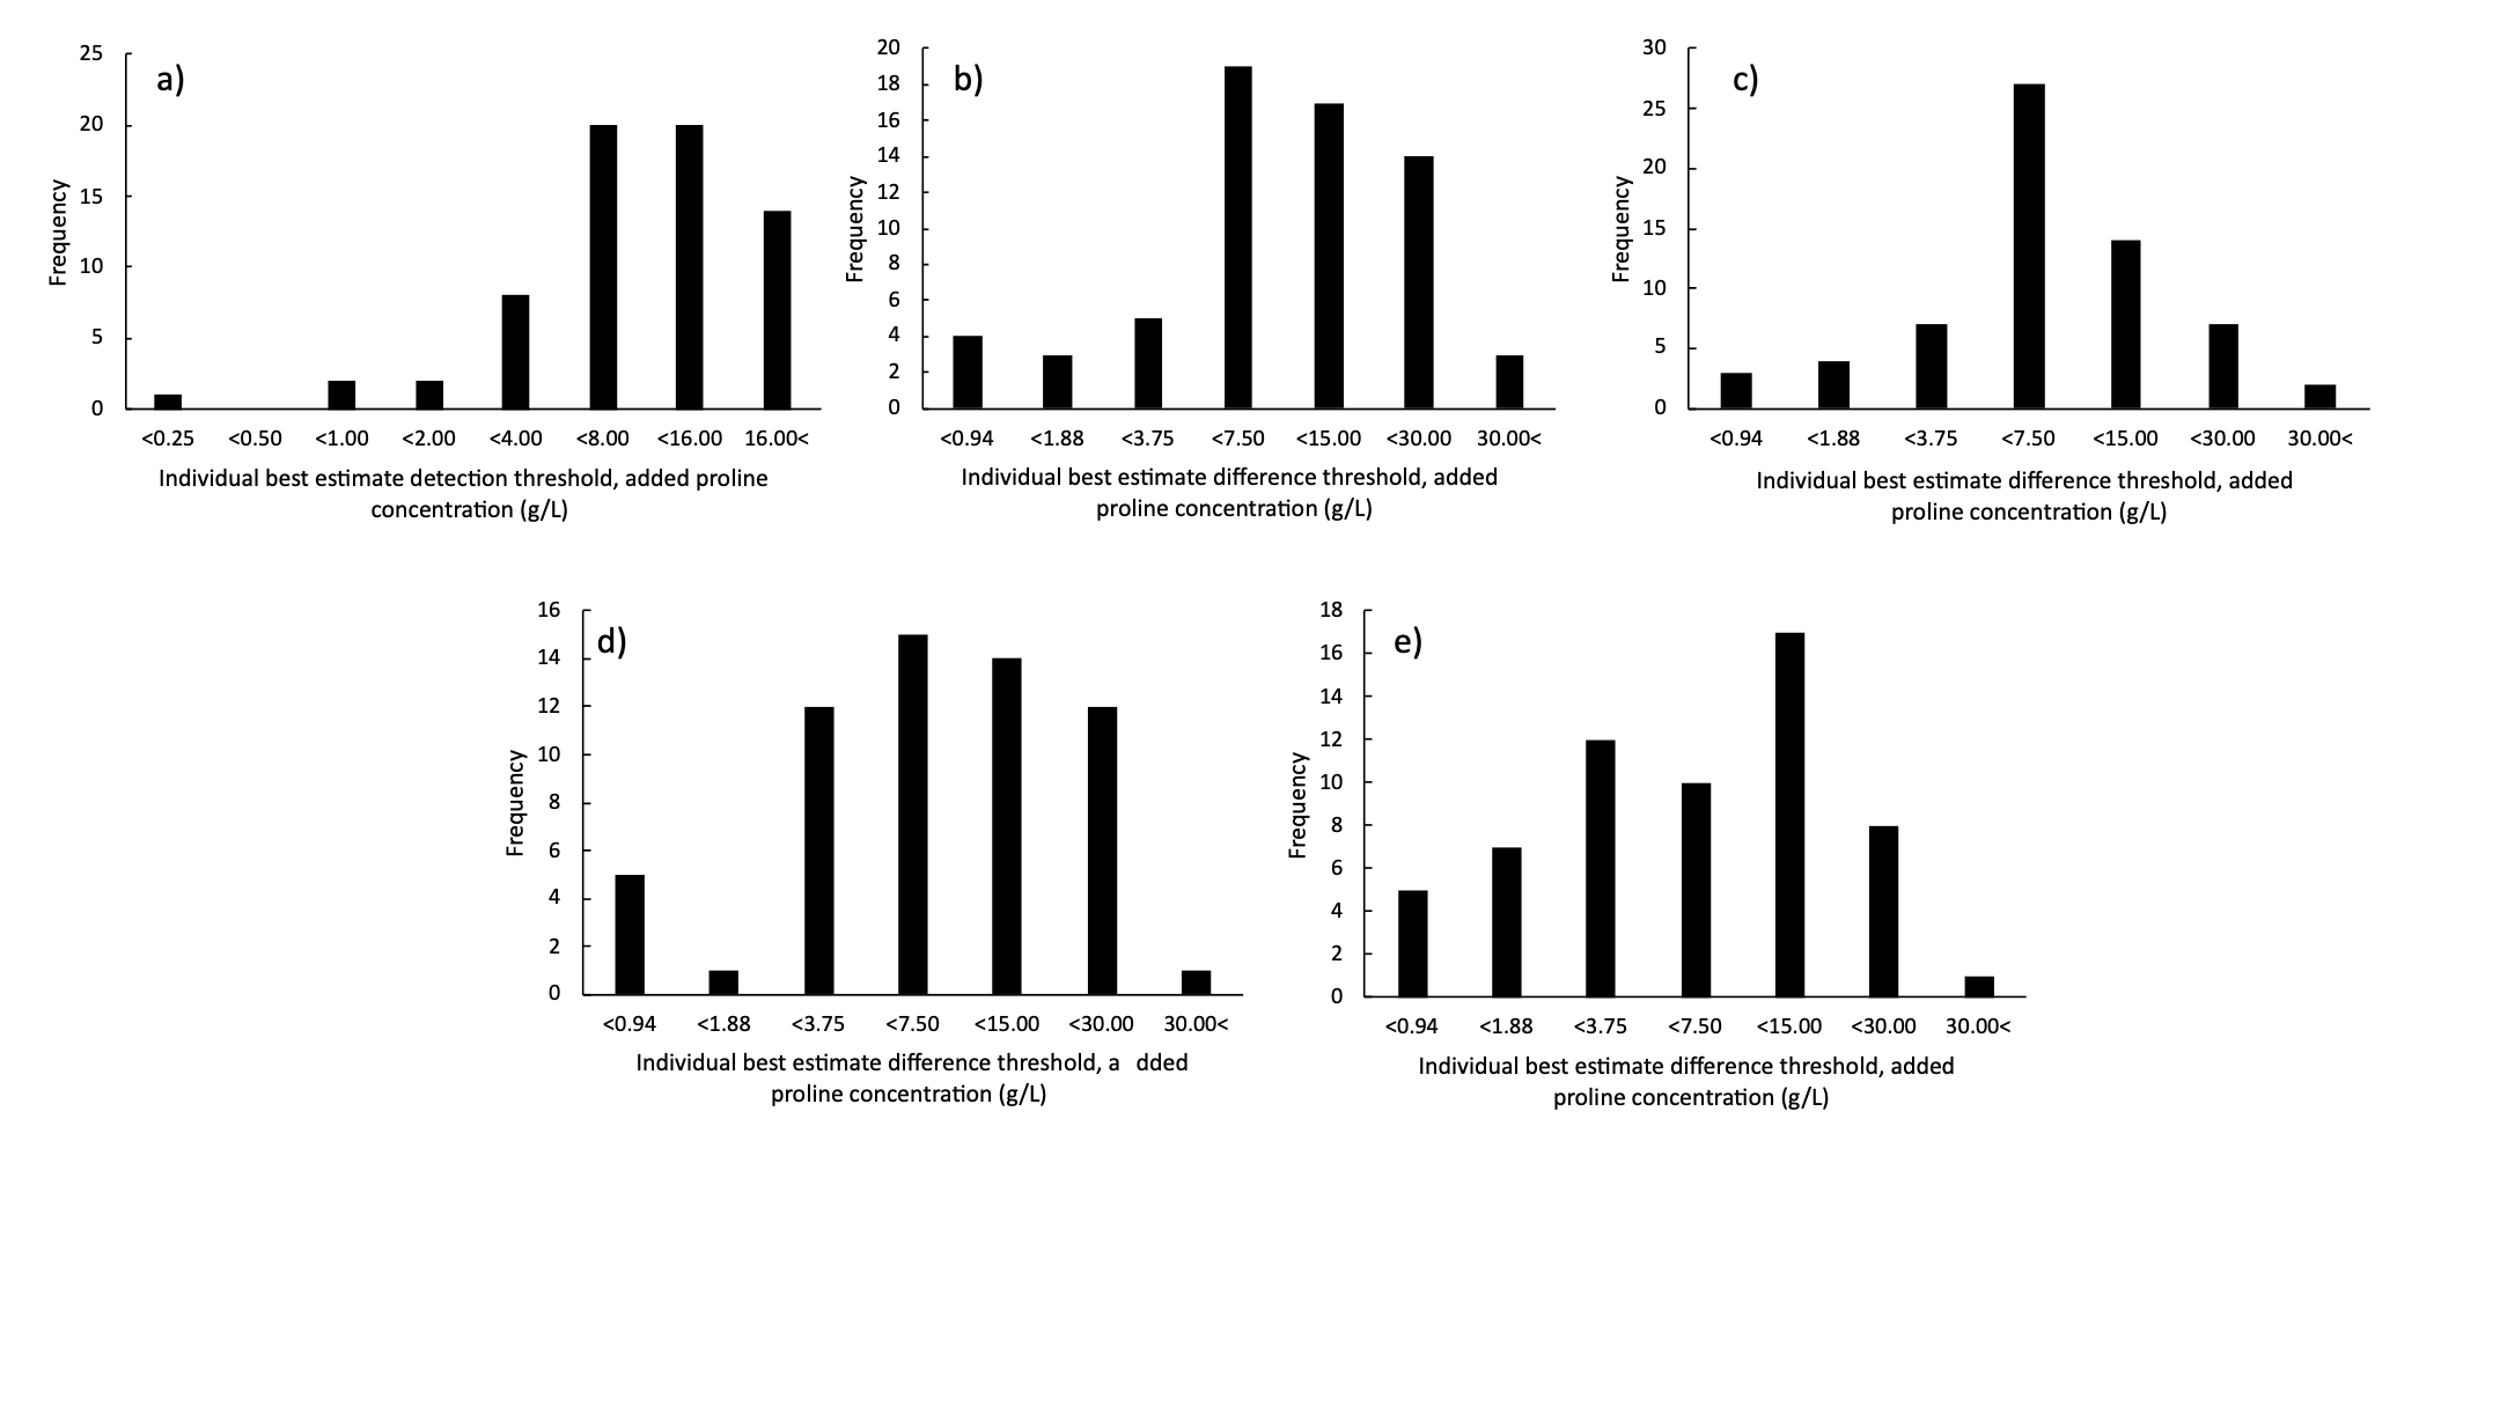
Figure 3. Histograms depicting the frequency of individual best estimate detection thresholds for proline added to (a) model wine x̄ = 7.33 g/L and individual difference thresholds for (b) Pinot Grigio n = 65 x̄ = 7.4 g/L, (c) Chardonnay n = 64 x̄ = 5.9 g/L, (d) Grenache Shiraz Mourvèdre n = 60 x̄ = 6.1 g/L, and (e) Shiraz n = 60 wines x̄ = 5.0 g/L.
4. Limitations
Several limitations should be acknowledged in this study. The convenience sampling approach, although broad, may not capture the full breadth of wine production practices. Varied bottle age, winemaking protocols and potential blending of the surveyed samples may have introduced confounding factors in proline concentration beyond those specified by regional climatic effects, geographical location, vintages, and variety. Furthermore, Australia and other nations have specific laws allowing blending, amelioration, aqueous additions beyond labelling requirements and even controlled dehydration of grapes in the case of passito, botrytis-affected, and Amarone-style wines, adding to the unknown variability in the study. It was also not possible for all factors to be represented in equal proportion. While the climatic data provided indication of statistical associations, site-specific influences, including irrigation practices, variability in Geographic Indicator size, and detailed vineyard water status, were unable to be curated to the individual wine level, and thus may obscure additional sources of variation influencing proline concentration. Although the sensory threshold experiments, in addition to previous studies, yielded practical insights, such standardised evaluations can be influenced by carryover effects and variations in individual sensory acuity. As likely seen in this study when comparing BET values and previously published QDSA ratings of proline addition, standardised sensory threshold tests in complex matrices, such as wine, can be overestimated due to participant inattention, lack of training with the specific stimulus, lack of replication within participant ratings or guessing. This may warrant additional controlled studies, using more sensitive sensory methods such as QDSA, particularly for non-Australian wines, to validate and expand upon these findings. Although the sampling spans multiple regions and climates, there was a bias toward moderate and warm viticultural zones, which may not fully represent the entire spectrum of winegrowing environments globally. Future studies involving cooler and more extreme climatic conditions internationally would be needed to establish a more complete understanding of proline concentrations across diverse wine regions and cultivars. Contrary to international perceptions, Australian grape growing regions offer substantial climatic diversity, from the cold, frequently snow-blanketed areas of Tasmania and the Victorian Alps to much warmer inland and desert regions. Nevertheless, a truly global perspective would require expanded research efforts in even broader settings, with samples from Old World and New World producers beyond the international samples in Table S2. Despite these limitations, the very large sample size for this study, combined with climate indices and sensory testing, provides a comprehensive indication of proline distribution and importance.
Conclusion
In summary, this study underscores the wide variation of proline concentration across wines, and it quantifies its sensory importance. By systematically quantifying proline concentrations across a wide range of Australian and some international wines, this research reveals its considerable variability within and between grape varietal wines and blends.
In combination with the previously published sensory effects, the data presented highlights proline as a potential target for manipulation through measurement and blending until future viticultural or oenological methods are found to exert further control.
Proline concentration in wines showed limited correlation with other variables, but for Cabernet-Sauvignon there were indications of potential relationships with solar radiation, evaporation and nighttime minimum temperature, which could be studied further in addition to other possible factors such as soil characteristics.
The findings highlight proline's contribution to wine in-mouth sensory properties with sensory threshold values similar to those imparted by residual sugars, adding to previous work showing increased sensory attributes such as sweetness, viscosity, and fruit flavours and diminished astringency and bitterness, together increasing consumer acceptance.
Acknowledgments
This work was supported by Wine Australia, with levies from Australia’s grapegrowers and winemakers and matching funds from the Australian Government. The AWRI is a member of the Wine Innovation Cluster in Adelaide, SA. This research used NCRIS-enabled 'Metabolomics Australia' infrastructure. Metabolomics South Australia is funded through Bioplatforms Australia Pty Ltd (BPA) and investment from the South Australian State Government and the Australian Wine Research Institute. Affinity Labs (formerly AWRI Commercial Services) is thanked for particular chemical analysis. The authors thank the members of the AWRI descriptive and technical quality sensory panels, as well as colleagues Dr Deanna Langone, Ms Eleanor Bilogrevic, Ms Stella Kassara, Ms Renata Kucera, and Mr Felix Baumann from the Bavarian State Institute for Viticulture and Horticulture for technical assistance.
References
- Berg, H. W. (1955). Evaluation of thresholds and minimum difference concentrations for various constituents of wines. Food Technol, 9, 23-26. https://cir.nii.ac.jp/crid/1571135649923936768
- Blesic, M., Karšić, E., Spaho, N., & Smajic Murtic, M. (2021). Influence of surgar and acid concentrations to sweetness threshold of still white wines. Works of the Faculty of Agriculture and Food Sciences, LXV(70), 160-170.
- De La Presa-Owens, C., Lamuela-Raventos, R. M., Buxaderas, S., & De La Torre-Boronat, M. C. (1995). Differentiation and Grouping Characteristics of Varietal Grape Musts from Penedès Region (I). American Journal of Enology and Viticulture, 46(3), 283. https://doi.org/10.5344/ajev.1995.46.3.283
- Espinase Nandorfy, D., Likos, D., Lewin, S., Barter, S., Kassara, S., Wang, S., Kulcsar, A., Williamson, P., Bindon, K., Bekker, M., Gledhill, J., Siebert, T., Shellie, R. A., Keast, R., & Francis, L. (2023). Enhancing the sensory properties and consumer acceptance of warm climate red wine through blending. OENO One, 57(4). https://doi.org/10.20870/oeno-one.2023.57.3.7651
- Espinase Nandorfy, D., Watson, F., Likos, D., Siebert, T., Bindon, K., Kassara, S., Shellie, R., Keast, R., & Francis, I. L. (2022). Influence of amino acids, and their interaction with volatiles and polyphenols, on the sensory properties of red wine. Australian Journal of Grape and Wine Research, 28(4), 621-637. https://doi.org/https://doi.org/10.1111/ajgw.12564
- Fila, G., Gardiman, M., Belvini, P., Meggio, F., & Pitacco, A. (2014). A comparison of different modelling solutions for studying grapevine phenology under present and future climate scenarios. Agricultural and Forest Meteorology, 195-196, 192-205. https://doi.org/https://doi.org/10.1016/j.agrformet.2014.05.011
- García de Cortázar-Atauri, I., Brisson, N., & Gaudillere, J. P. (2009). Performance of several models for predicting budburst date of grapevine (Vitis vinifera L.). International Journal of Biometeorology, 53(4), 317-326. https://doi.org/10.1007/s00484-009-0217-4
- Gardner, J. M., Poole, K., & Jiranek, V. (2002). Practical significance of relative assimilable nitrogen requirements of yeast: a preliminary study of fermentation performance and liberation of H2S. Australian Journal of Grape and Wine Research, 8(3), 175-179. https://doi.org/https://doi.org/10.1111/j.1755-0238.2002.tb00253.x
- Godelmann, R., Fang, F., Humpfer, E., Schütz, B., Bansbach, M., Schäfer, H., & Spraul, M. (2013). Targeted and Nontargeted Wine Analysis by 1H NMR Spectroscopy Combined with Multivariate Statistical Analysis. Differentiation of Important Parameters: Grape Variety, Geographical Origin, Year of Vintage. Journal of Agricultural and Food Chemistry, 61(23), 5610-5619. https://doi.org/10.1021/jf400800d
- Gutiérrez-Gamboa, G., Garde-Cerdán, T., Moreno-Simunovic, Y., & Pérez-Álvarez, E. P. (2019). 10 - Amino Acid Composition of Grape Juice and Wine: Principal Factors That Determine Its Content and Contribution to the Human Diet. In A. M. Grumezescu & A. M. Holban (Eds.), Nutrients in Beverages (pp. 369-391). Academic Press. https://doi.org/https://doi.org/10.1016/B978-0-12-816842-4.00010-1
- Hall, A., & Blackman, J. (2019). Modelling within-region spatiotemporal variability in grapevine phenology with high resolution temperature data: This article is published in cooperation with the 21th GIESCO International Meeting, June 23-28 2019, Thessaloniki, Greece. Guests editors : Stefanos Koundouras and Laurent Torregrosa. OENO One, 53(2). https://doi.org/10.20870/oeno-one.2019.53.2.2450
- Hall, A., Mathews, A. J., & Holzapfel, B. P. (2016). Potential effect of atmospheric warming on grapevine phenology and post-harvest heat accumulation across a range of climates. Int J Biometeorol, 60(9), 1405-1422. https://doi.org/10.1007/s00484-016-1133-z
- Herraiz, T., & Ough, C. S. (1993). Formation of Ethyl Esters of Amino Acids by Yeasts During the Alcoholic Fermentation of Grape Juice. American Journal of Enology and Viticulture, 44(1), 41. https://doi.org/10.5344/ajev.1993.44.1.41
- Hinreiner, E., Filipello, F., Berg, H. W., & Webb, A. D. (1955). Evaluation of thresholds and minimum difference concentrations for various constituents of wines. IV. Detectable differences in wine. Food Technol, 9, 489-490.
- Huang, Z., & Ough, C. S. (1991). Amino Acid Profiles of Commercial Grape Juices and Wines. American Journal of Enology and Viticulture, 42(3), 261. http://www.ajevonline.org/content/42/3/261.abstract
- Hufnagel, J. C., & Hofmann, T. (2008). Quantitative reconstruction of the nonvolatile sensometabolome of a red wine. J Agric Food Chem, 56(19), 9190-9199. https://doi.org/10.1021/jf801742w
- Ingledew, W. M., Magnus, C. A., & Sosulski, F. W. (1987). Influence of Oxygen on Proline Utilization During the Wine Fermentation. American Journal of Enology and Viticulture, 38(3), 246. https://doi.org/10.5344/ajev.1987.38.3.246
- Jeffrey, S. J., Carter, J. O., Moodie, K. B., & Beswick, A. R. (2001). Using spatial interpolation to construct a comprehensive archive of Australian climate data. Environmental Modelling & Software, 16(4), 309-330. https://doi.org/https://doi.org/10.1016/S1364-8152(01)00008-1
- Lattey, K. A., Bramley, B. R., & Francis, I. L. (2010). Consumer acceptability, sensory properties and expert quality judgements of Australian Cabernet-Sauvignon and Shiraz wines. Australian Journal of Grape and Wine Research, 16(1), 189-202. https://doi.org/https://doi.org/10.1111/j.1755-0238.2009.00069.x
- Lawless, H. T., & Heymann, H. (2010). Measurement of Sensory Thresholds. In H. T. Lawless & H. Heymann (Eds.), Sensory Evaluation of Food: Principles and Practices (pp. 125-147). Springer New York. https://doi.org/10.1007/978-1-4419-6488-5_6
- Lehtonen, P. (1996). Determination of Amines and Amino Acids in Wine — A Review. American Journal of Enology and Viticulture, 47(2), 127. http://www.ajevonline.org/content/47/2/127.abstract
- Leolini, L., Costafreda-Aumedes, S., Santos, J., Menz, C., Fraga, H., Molitor, D., Merante, P., Junk, J., Kartschall, T., Destrac Irvine, A., van Leeuwen, C., Malheiro, A., Eiras-Dias, J., Silvestre, J., Dibari, C., Bindi, M., & Moriondo, M. (2020). Phenological Model Intercomparison for Estimating Grapevine Budbreak Date (Vitis vinifera L.) in Europe. Applied Sciences, 10, 3800. https://doi.org/10.3390/app10113800
- Long, D., Wilkinson, K. L., Taylor, D. K., & Jiranek, V. (2018). Novel Wine Yeast for Improved Utilisation of Proline during Fermentation. Fermentation, 4(1).
- McBurney, D. H., & Bartoshuk, L. M. (1973). Interactions between stimuli with different taste qualities. Physiology & Behavior, 10(6), 1101-1106. https://doi.org/https://doi.org/10.1016/0031-9384(73)90194-7
- Moncur, M. W., Rattigan, K., Mackenzie, D. H., & Mc Intyre, G. N. (1989). Base Temperatures for Budbreak and Leaf Appearance of Grapevines. American Journal of Enology and Viticulture, 40(1), 21. https://doi.org/10.5344/ajev.1989.40.1.21
- Omura, F., Fujita, A., Miyajima, K., & Fukui, N. (2005). Engineering of yeast Put4 permease and its application to lager yeast for efficient proline assimilation. Biosci Biotechnol Biochem, 69(6), 1162-1171. https://doi.org/10.1271/bbb.69.1162
- Ough, C. S., & Stashak, R. M. (1974). Further Studies on Proline Concentration in Grapes and Wines. American Journal of Enology and Viticulture, 25(1), 7. http://www.ajevonline.org/content/25/1/7.abstract
- Pearson, W., Schmidtke, L. M., Francis, I. L., Li, S., Hall, A., & Blackman, J. W. (2021). Regionality in Australian Shiraz: compositional and climate measures that relate to key sensory attributes. Australian Journal of Grape and Wine Research, 27(4), 458-471. https://doi.org/https://doi.org/10.1111/ajgw.12499
- Schiffman, S. S., Sennewald, K., & Gagnon, J. (1981). Comparison of taste qualities and thresholds of D- and L-amino acids. Physiology & Behavior, 27(1), 51-59. https://doi.org/https://doi.org/10.1016/0031-9384(81)90298-5
- Skogerson, K., Runnebaum, R., Wohlgemuth, G., de Ropp, J., Heymann, H., & Fiehn, O. (2009). Comparison of Gas Chromatography-Coupled Time-of-Flight Mass Spectrometry and 1H Nuclear Magnetic Resonance Spectroscopy Metabolite Identification in White Wines from a Sensory Study Investigating Wine Body. Journal of Agricultural and Food Chemistry, 57(15), 6899-6907. https://doi.org/10.1021/jf9019322
- Stines, A. P., Grubb, J., Gockowiak, H., Henschke, P. A., HØJ, P. B., & van Heeswijck, R. (2000). Proline and arginine accumulation in developing berries of Vitis vinifera L. in Australian vineyards: Influence of vine cultivar, berry maturity and tissue type. Australian Journal of Grape and Wine Research, 6(2), 150-158. https://doi.org/https://doi.org/10.1111/j.1755-0238.2000.tb00174.x
- Takagi, H. (2019). Metabolic regulatory mechanisms and physiological roles of functional amino acids and their applications in yeast. Bioscience, Biotechnology, and Biochemistry, 83(8), 1449-1462. https://doi.org/10.1080/09168451.2019.1576500
- Van Gemert, L. J. (2011). Flavour thresholds. Compilations of Flavour Threshold Values in Water and Other Media. 2nd edn. Utrecht: Oliemans Punter & Partner.
- Verdenal, T., Dienes-Nagy, Á., Spangenberg, J. E., Zufferey, V., Spring, J.-L., Viret, O., Marin-Carbonne, J., & van Leeuwen, C. (2021). Understanding and managing nitrogen nutrition in grapevine: a review. OENO One, 55(1), 1-43. https://doi.org/10.20870/oeno-one.2021.55.1.3866
- Watson, F. T., Teng, D., Bindon, K., Kassara, S., Lloyd, N. D. R., Price, W. S., Torres, A., Nilsson, M., Herderich, M. J., & Nandorfy, D. E. (2025). Robust, automated quantitation of proline in wine. Food Chemistry, 493, 145386. https://doi.org/https://doi.org/10.1016/j.foodchem.2025.145386
- Williamson, P. O., Robichaud, J., & Francis, I. L. (2012). Comparison of Chinese and Australian consumers' liking responses for red wines. Australian Journal of Grape and Wine Research, 18(3), 256-267. https://doi.org/https://doi.org/10.1111/j.1755-0238.2012.00201.x
 Views: 296
 XML: 22