

ENOLOGY / Short communications
Abstract
Detecting methoxypyrazines such as 3-isobutyl-2-methoxypyrazine (IBMP) in wine grapes constitutes a significant challenge due to the extremely low concentrations at which they impart orthonasal sensory effects. Associated with vegetal or 'green' aromas in wine, IBMP accumulates in immature grapes and diminishes with maturity. Such aromas can be viewed as detrimental to the quality of red wines, with Cabernet-Sauvignon being a particularly vulnerable variety. The sensory threshold for red wine matrices is recognised to range from 2 to 16 ng/L. Hence, detection conventionally requires expensive, time-consuming analysis by gas chromatography with mass spectrometry. Seeking a fast (i.e., < 10 min per sample) and inexpensive assay, this study investigated the ability to empirically predict IBMP in red winegrape varieties using HORIBA's patented absorbance-transmittance and fluorescence excitation-emission matrix (A-TEEM) spectroscopy. Cabernet-Sauvignon, Carménère, Merlot, and Cabernet franc grapes were sourced and extracted during harvest season over a period of 4 years from > 70 vineyards throughout Chile. A-TEEM spectral data represented the fusion of the UV-Vis absorbance and unfolded fluorescence EEM to yield more than 10,000 variables per sample. Model optimisation included a recursive partial least squares variable selection for the calibration set, and IBMP test set predictions were evaluated by multivariate regression using a randomly selected calibration/validation set of 1816/584 samples (including replication). Importantly, both cross-validation (CV) and test set prediction were based on exclusive sample repetition classes to eliminate replicate trapping. Support vector machine (SVM) regression yielded root mean square errors for calibration, CV, and test set prediction of < 0.4 ng/kg, with an R2 = 0.879. The regression results were supplemented by SVM discriminant analysis based on a pass/fail threshold of 2 ng/kg, yielding a Matthews correlation coefficient of 0.970 with no misclassified samples in the < 2 ng/kg class. This work highlights the potential of A-TEEM with machine learning data analysis to provide an inexpensive, rapid, and accurate screening method for IBMP in extracts of susceptible red winegrape varieties at or below the typical wine sensory threshold.
Introduction
Determining grape maturity prior to harvest is critical for managing undesirable green aromas associated with methoxypyrazines that accumulate in immature grape berries of various Vitis vinifera cultivars. The main compound of concern is 3-isobutyl-2-methoxypyrazine (IBMP), which has an extremely low odour detection threshold of 2 ng/kg in water and 2–16 ng/kg in wine (Botezatu et al., 2016; Belancic & Agosin, 2007; Romero et al., 2006). IBMP is typically present at ultratrace concentrations around its detection threshold; consequently, its quantification relies on highly sensitive analytical techniques, most commonly gas chromatography coupled with tandem mass spectrometry (GC-MS/MS) using headspace solid-phase microextraction (SPME). Using deuterated internal standards with SPME-GC-MS/MS affords reported limits of detection (LOD) and quantification (LOQ) of 0.13 ng/kg and 0.44 ng/kg (Sanders et al., 2022; Sanders et al., 2023). Such sensitivity is important considering the low abundance (and high sensory impact) of IBMP, but the GC-MS/MS approach involves high capital and operational expenses, time, and considerable operational experience. Contract laboratory analysis is available using the same technique, but it can be prohibitively expensive. Moreover, turnaround times of days or more preclude timely and effective decision-making regarding vineyard interventions or the state of ripeness required for harvest.
To circumvent the use of GC-MS/MS, or provide a supplementary screening method, especially for a commercial winemaking setting, investigation has focused on rapid optical methods, including UV-Vis absorbance and fluorescence spectroscopy. One method, known as absorbance-transmittance and fluorescence excitation-emission matrix (A-TEEM) spectroscopy, has been recently reported to provide predictive accuracy in the ng/kg range for IBMP that is comparable to GC-MS/MS (Armstrong et al., 2023). A-TEEM spectroscopy is multidimensional, simultaneously acquiring absorbance extinction, absorbance spectra, fluorescence quantum efficiencies, and excitation and emission spectral variable information. Notably, A-TEEM spectroscopy employs real-time inner filter effect correction to overcome nonlinear concentration-dependent distortions of the fluorescence data (Gilmore & Schober, 2025b). A-TEEM data is typically analysed using a multiblock model format that fuses all the acquired variables to enhance the precision and accuracy of chemometric algorithms used for regression and discrimination analysis (Schober et al., 2022; Gilmore & Schober, 2025a).
The capacity of A-TEEM to quantitatively predict IBMP in Cabernet-Sauvignon, Merlot, Carménère, and Cabernet franc was investigated for grape samples obtained over four vintages and encompassing seventy-two individual vineyards across Chile. Of particular interest was determining the ability to generate universal regression and quantitative discrimination models that allow IBMP detection and quantification below reported sensory threshold levels. A-TEEM grape extract models were calibrated against reference measurement of IBMP by SPME-GC-MS/MS. The calibration and test data were carefully organised by class assignment such that no replicate samples could bias the cross-validation (CV) or test set statistics. Results of both regression and discrimination models using the support vector machine (SVM) algorithm are reported to gauge the utility of the A-TEEM approach for routine IBMP measurements. The capacity of the methodology is discussed with respect to advantages and disadvantages compared to quantification of IBMP by SPME GC-MS/MS and to the conceivable adoption of A-TEEM by the wine industry.
Materials and methods
1. Analysis of IBMP in grape extracts
Grapes were obtained at commercial harvest, with split samples prepared as described previously for SPME-GC-MS/MS analysis (Sanders et al., 2023) and for A-TEEM analysis (Gilmore & Schober, 2025a) using an Aqualog® UV-800C (HORIBA Instruments Inc., Piscataway NJ USA). As shown in Table 1, 2400 samples were prepared for A-TEEM analysis from Cabernet franc, Cabernet-Sauvignon, Carménère, and Merlot over four vintages (2020–2022 and 2024) and split 75:25 to derive calibration and test sets, respectively. The data were collected for grape samples obtained from seventy-two vineyards (Table S1).
Number of samples | |||
|---|---|---|---|
Calibration | Test | ||
Vintage | |||
2020 | 855 | 285 | |
2021 | 392 | 145 | |
2022 | 141 | 34 | |
2024 | 428 | 120 | |
sum | 1816 | 584 | |
Variety | |||
Cabernet franc | 12 | 0 | |
Cabernet- Sauvignon | 1499 | 488 | |
Carménère | 246 | 91 | |
Merlot | 59 | 5 | |
sum | 1816 | 584 | |
2. Multivariate analysis: regression and discrimination
For purposes of regression and discrimination, the data consisting of spectral replicates were split into a calibration set (1816 samples) and a test set (584 samples). There was a total of 554 individual grape samples that underwent SPME GC-MS/MS analysis, with 418 used for calibration and 136 for test set, respectively (i.e., 75:25 as specified earlier). The calibration and validation data groups were split randomly by first sorting the concentration values, then selecting the validation samples to ensure both the calibration and validation data covered the measurement range uniformly and the validation range did not significantly exceed the extremes of the calibration range. To prevent statistical bias from the replicate data (replicate trapping), CV settings and test sets were selected to mutually exclude all replicate samples corresponding to a single SPME GC-MS/MS measurement (i.e., replicates were kept together).
A-TEEM data regression and discriminant analysis were performed using the respective SVM algorithm after data preprocessing in Solo software (v9.5, Eigenvector Research, Inc., Manson, WA, USA). The spectral data (X-blocks) for the calibration and test prediction were assembled using a multiblock model as described previously (Schober et al., 2022). This included scaling the absorbance by the dilution factor (50-fold) and concatenating the absorbance variables with the unfolded EEM variables to yield a total of 10,416 variables per sample. The Calibration X-block was then subjected to a recursive partial least squares (RPLS) variable selection algorithm prior to regression and discrimination. IBMP concentrations (Y-blocks) were assembled using the values obtained for each grape sample from quantitative analysis by SPME-GC-MS/MS. The preprocessing, tuning, and CV settings for the regression and discrimination models are listed in Table S2. Pre-processing of the X- and Y-blocks included mean centreing, and the X-block also underwent iterative manual optimisation of the general least squares weighting (GLSW) for clutter removal. The manual iterative SVM tuning parameters included selection of type for either regression or discrimination and the optimal PLS latent variable number for X-block compression. All other SVM tuning parameters were automatically adjusted by the software.
Results and discussion
1. IBMP reference data characterisation
Descriptive statistics for IBMP reference concentration determined by SPME GC-MS/MS for over 550 grape samples are shown in Table 2. This outlines the maximum (Max) and minimum (Min) ranges, the mean and median (Med), and number (n) of samples in the calibration and test sets. The samples comprise a class-group of A-TEEM replicates for a single reference GC-MS/MS measurement. The test set was selected from the total set as described in the Materials and methods not only for exclusive classes but also to be fully representative of the calibration model’s IBMP concentration range. Both sets showed minimum to maximum ranges around 5.5 ng/kg IBMP, with similar mean and median values (Table 2). However, the variance and means of the calibration and test set’s reference chemistry were significantly different and indicated they represented unique populations.
Calibration | Test | |
|---|---|---|
Mean | 0.86 | 1.01 |
Max | 5.45 | 5.57 |
Min | 0 | 0 |
Med | 0.53 | 0.53 |
Var | 1.03 | 1.28 |
n | 1816 | 584 |
2. A-TEEM data and variable selection
Figure 1 shows a typical A-TEEM data set from an example red grape extract. The UV-Vis spectrum (Figure 1A) shows the typical absorbance peaks (including around 280 nm) associated with compounds containing aromatic rings such as low molecular weight phenolics (LMWPs), including major flavan-3-ols as described by Gilmore and Schober (2025a). Subsequent shoulders in the UV region (i.e., 240–400 nm) are mostly attributable to flavonols and hydroxycinnamates, whereas the prominent peak in the Vis region around 535 nm is due to anthocyanins in these red winegrape varieties. The EEM plot (Figure 1B) shows a complex contour region in the UV excitation-emission range attributed primarily to LMWPs. Although abundant in red grapes, anthocyanins generally exhibit a much lower fluorescence yield than LMWPs and are not visually apparent at the EEM scaling shown in Figure 1.
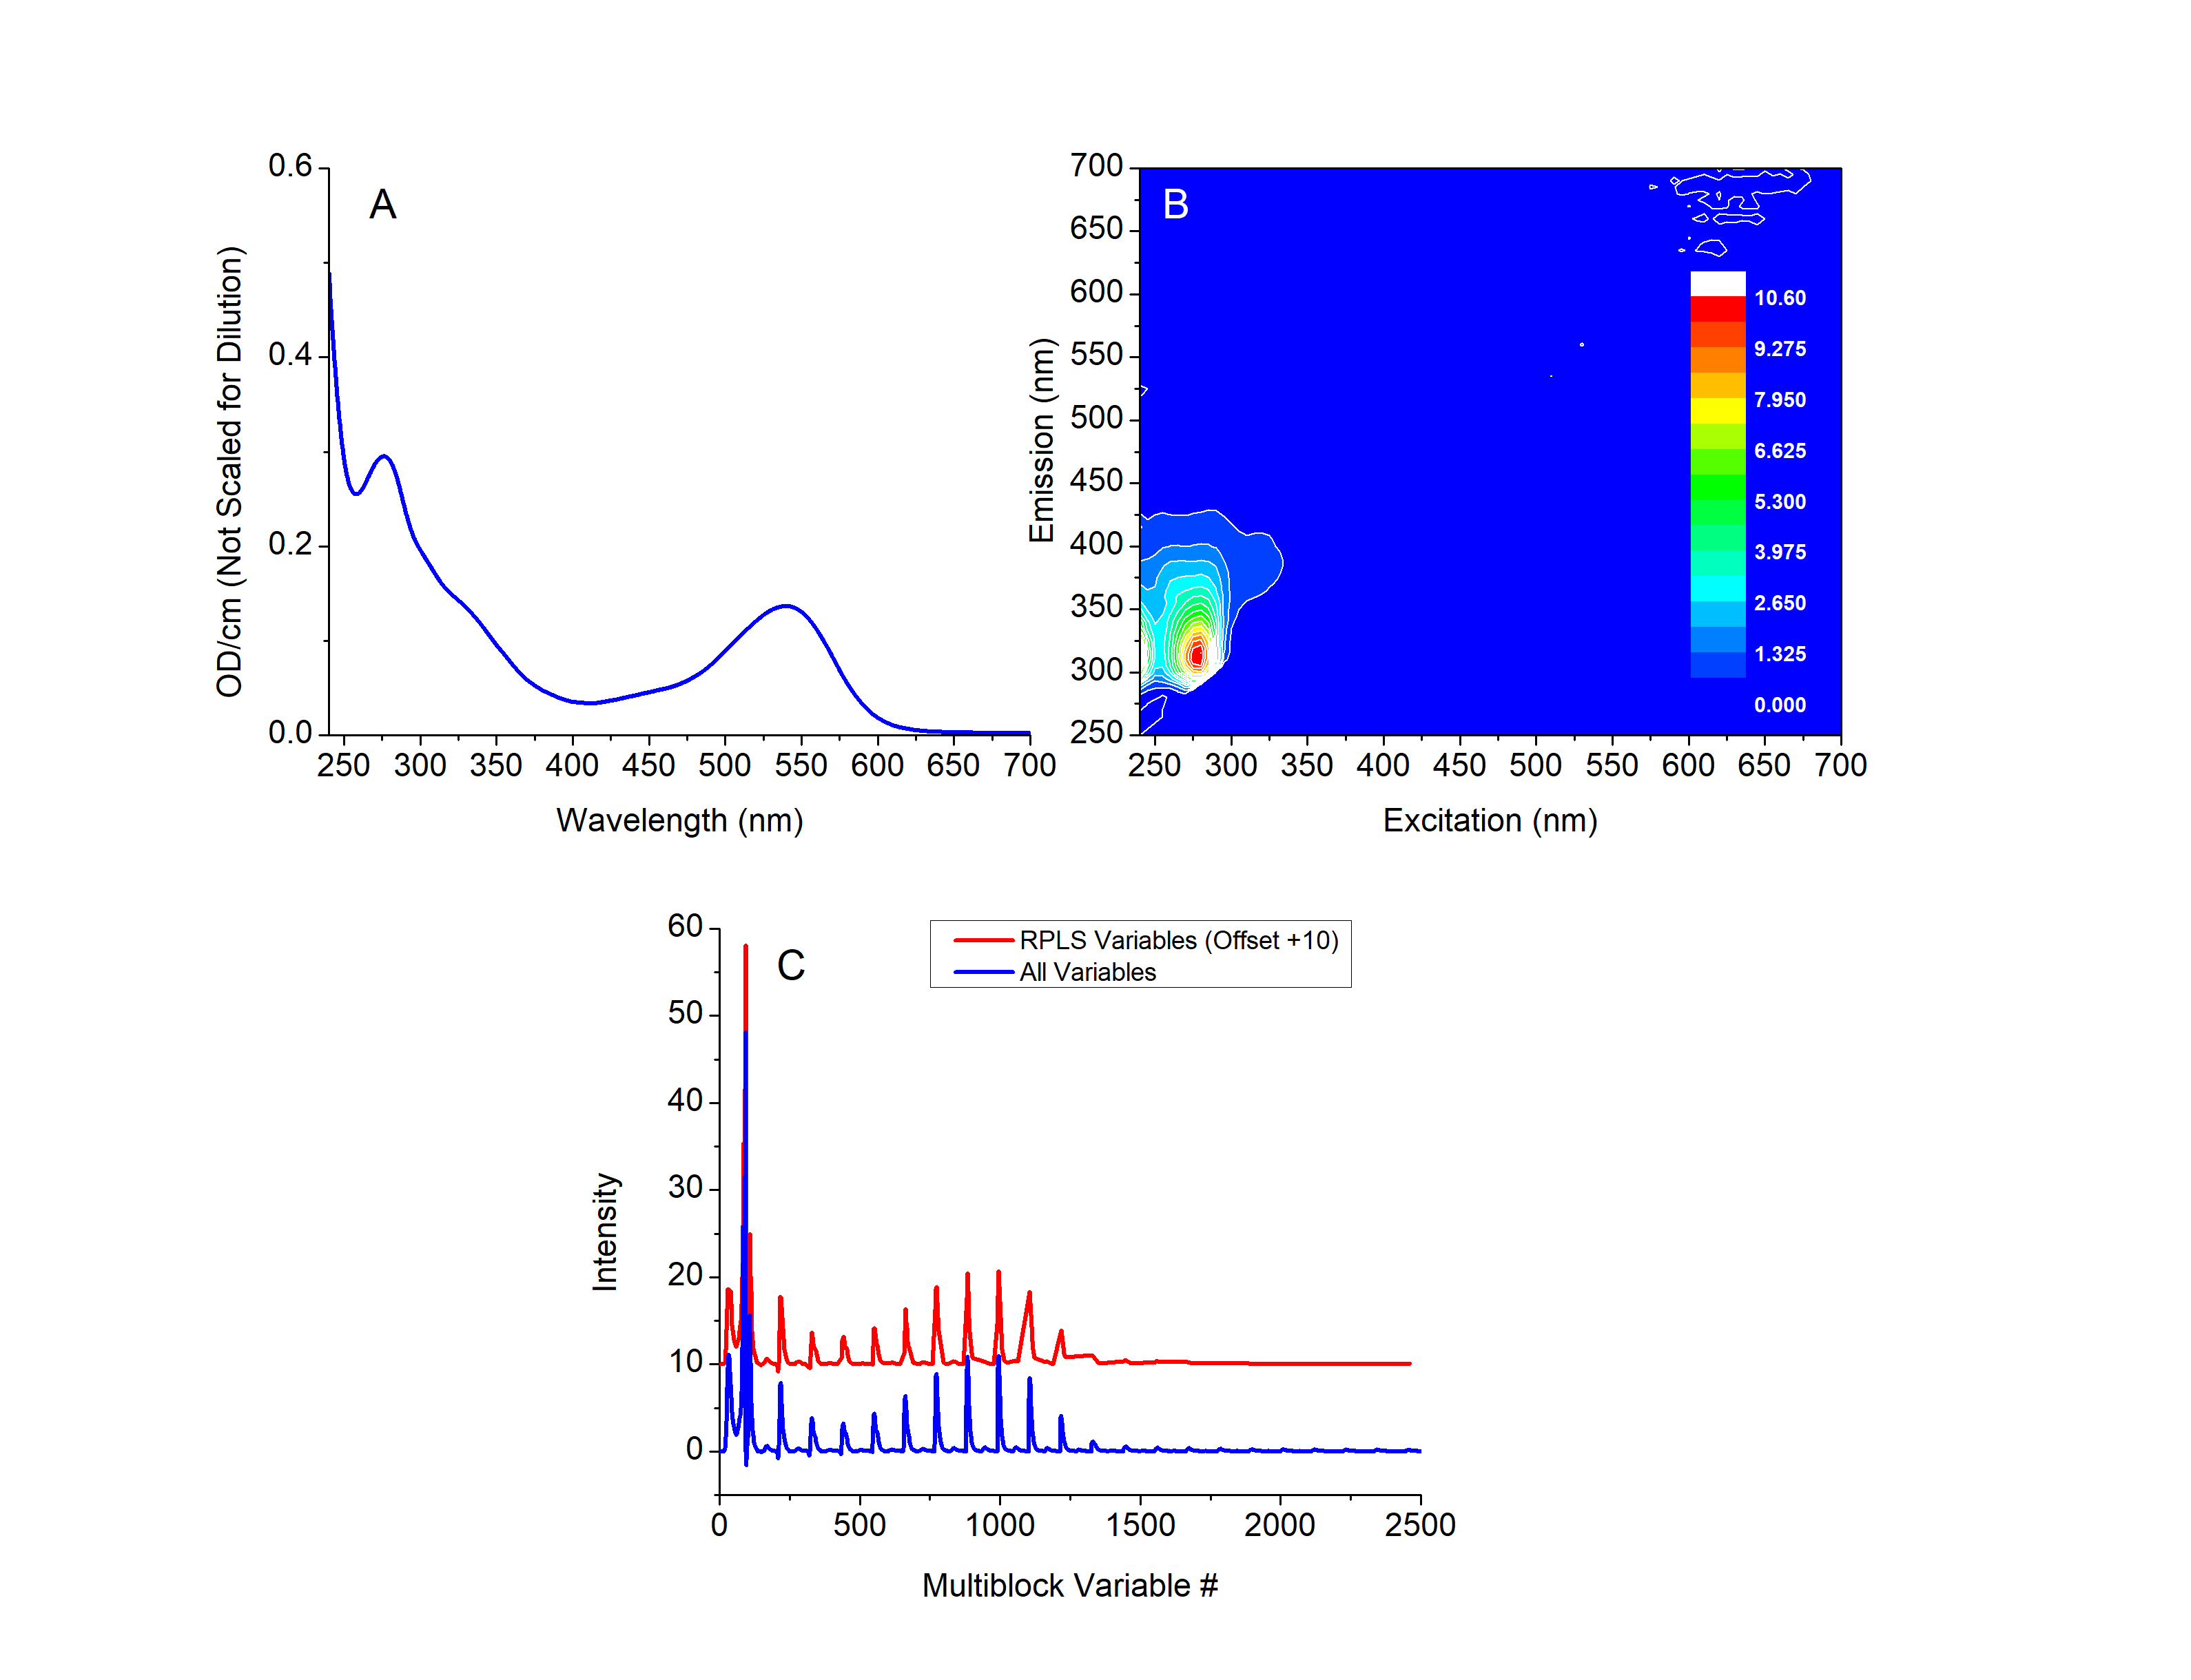
Figure 1. Representative A-TEEM data from a Cabernet-Sauvignon grape extract showing (A) the UV-Vis absorption spectra, (B) fluorescence EEM, and (C) multiblock organisation of the first 2500 concatenated absorbance variables (dilution scaled) and unfolded EEM variables (blue) overlaid with recursive partial least squares (RPLS) variable selection (red, offset by +10 intensity units for visual clarity) used for the modelling.
Figure 1C shows the results of both the multiblock data organisation of the absorbance and unfolded EEM variables (blue) and the subsequent RPLS variable selection (red) associated with the IBMP calibration model. The original multiblock data (blue) includes the scaled absorbance channels from the left proceeding to the unfolded EEM variables with increasing variable number. The RPLS variables, selected by minimising the CV RMSE of the calibration data, included the majority of the absorbance and unfolded EEM variables associated with the LMWP region. All variables outside of the RPLS window (i.e., > 2500), including those associated with anthocyanins, were excluded from the final models.
3. SVM regression to predict IBMP concentration with A-TEEM
Figure 2 compares the IBMP model results from the calibration (red) and test (blue) data sets using SVM regression with selected A-TEEM variables as a function of the reference concentrations from GC-MS/MS analysis. The regression lines are naturally superimposed because the model equations were rearranged to solve for predicted concentration variable (x), to yield both a unity slope and zero intercept. This serves the important function of isolating the RMSE value later to be used for calculating detection and quantification limit estimates. As summarised in Table 2, the calibration and test data both cover the measured IBMP range uniformly. The calibration R2 in Figure 2 was slightly higher (0.93) compared to the test (0.88); this is at least partly due to the fact the population of the calibration set was much larger. Furthermore, Cawley & Talbot (2010) noted that machine learning calibration sets typically exhibit an “optimistic bias”, meaning the test model is usually less accurate than calibration, with a lower R2 value and higher RMSE value. The test result, however, can more accurately reflect the model's true generalisation capacity, being based on unseen data, whereas the calibration model training includes noise patterns exclusive to the training data. Ultimately, there was a small difference between R2 calibration and test, reflecting the model’s realised ability for generalisation.
The results of the calibration, CV, and test IBMP models were further evaluated as a function of their respective RMSE values. The calibration RMSE was approximately 0.27 ng/kg, whereas the values for the CV and test were slightly higher, at just below 0.4 ng/kg. The correspondence between the CV and test values is consistent with the fact that both model expressions were based on unique data classes. Most importantly, both the RMSECV and RMSEP (< 0.4 ng/kg) are well below the lowest reported sensory threshold for red wines (2 ng/kg). The strong alignment between the CV and test performance demonstrates the model’s robustness. Given the CV and test model error of 0.4 ng/kg, estimated values for LOD and LOQ (i.e., 3.3 and 10 times the error) of IBMP using A-TEEM are 1.32 ng/kg and 4 ng/kg, respectively.
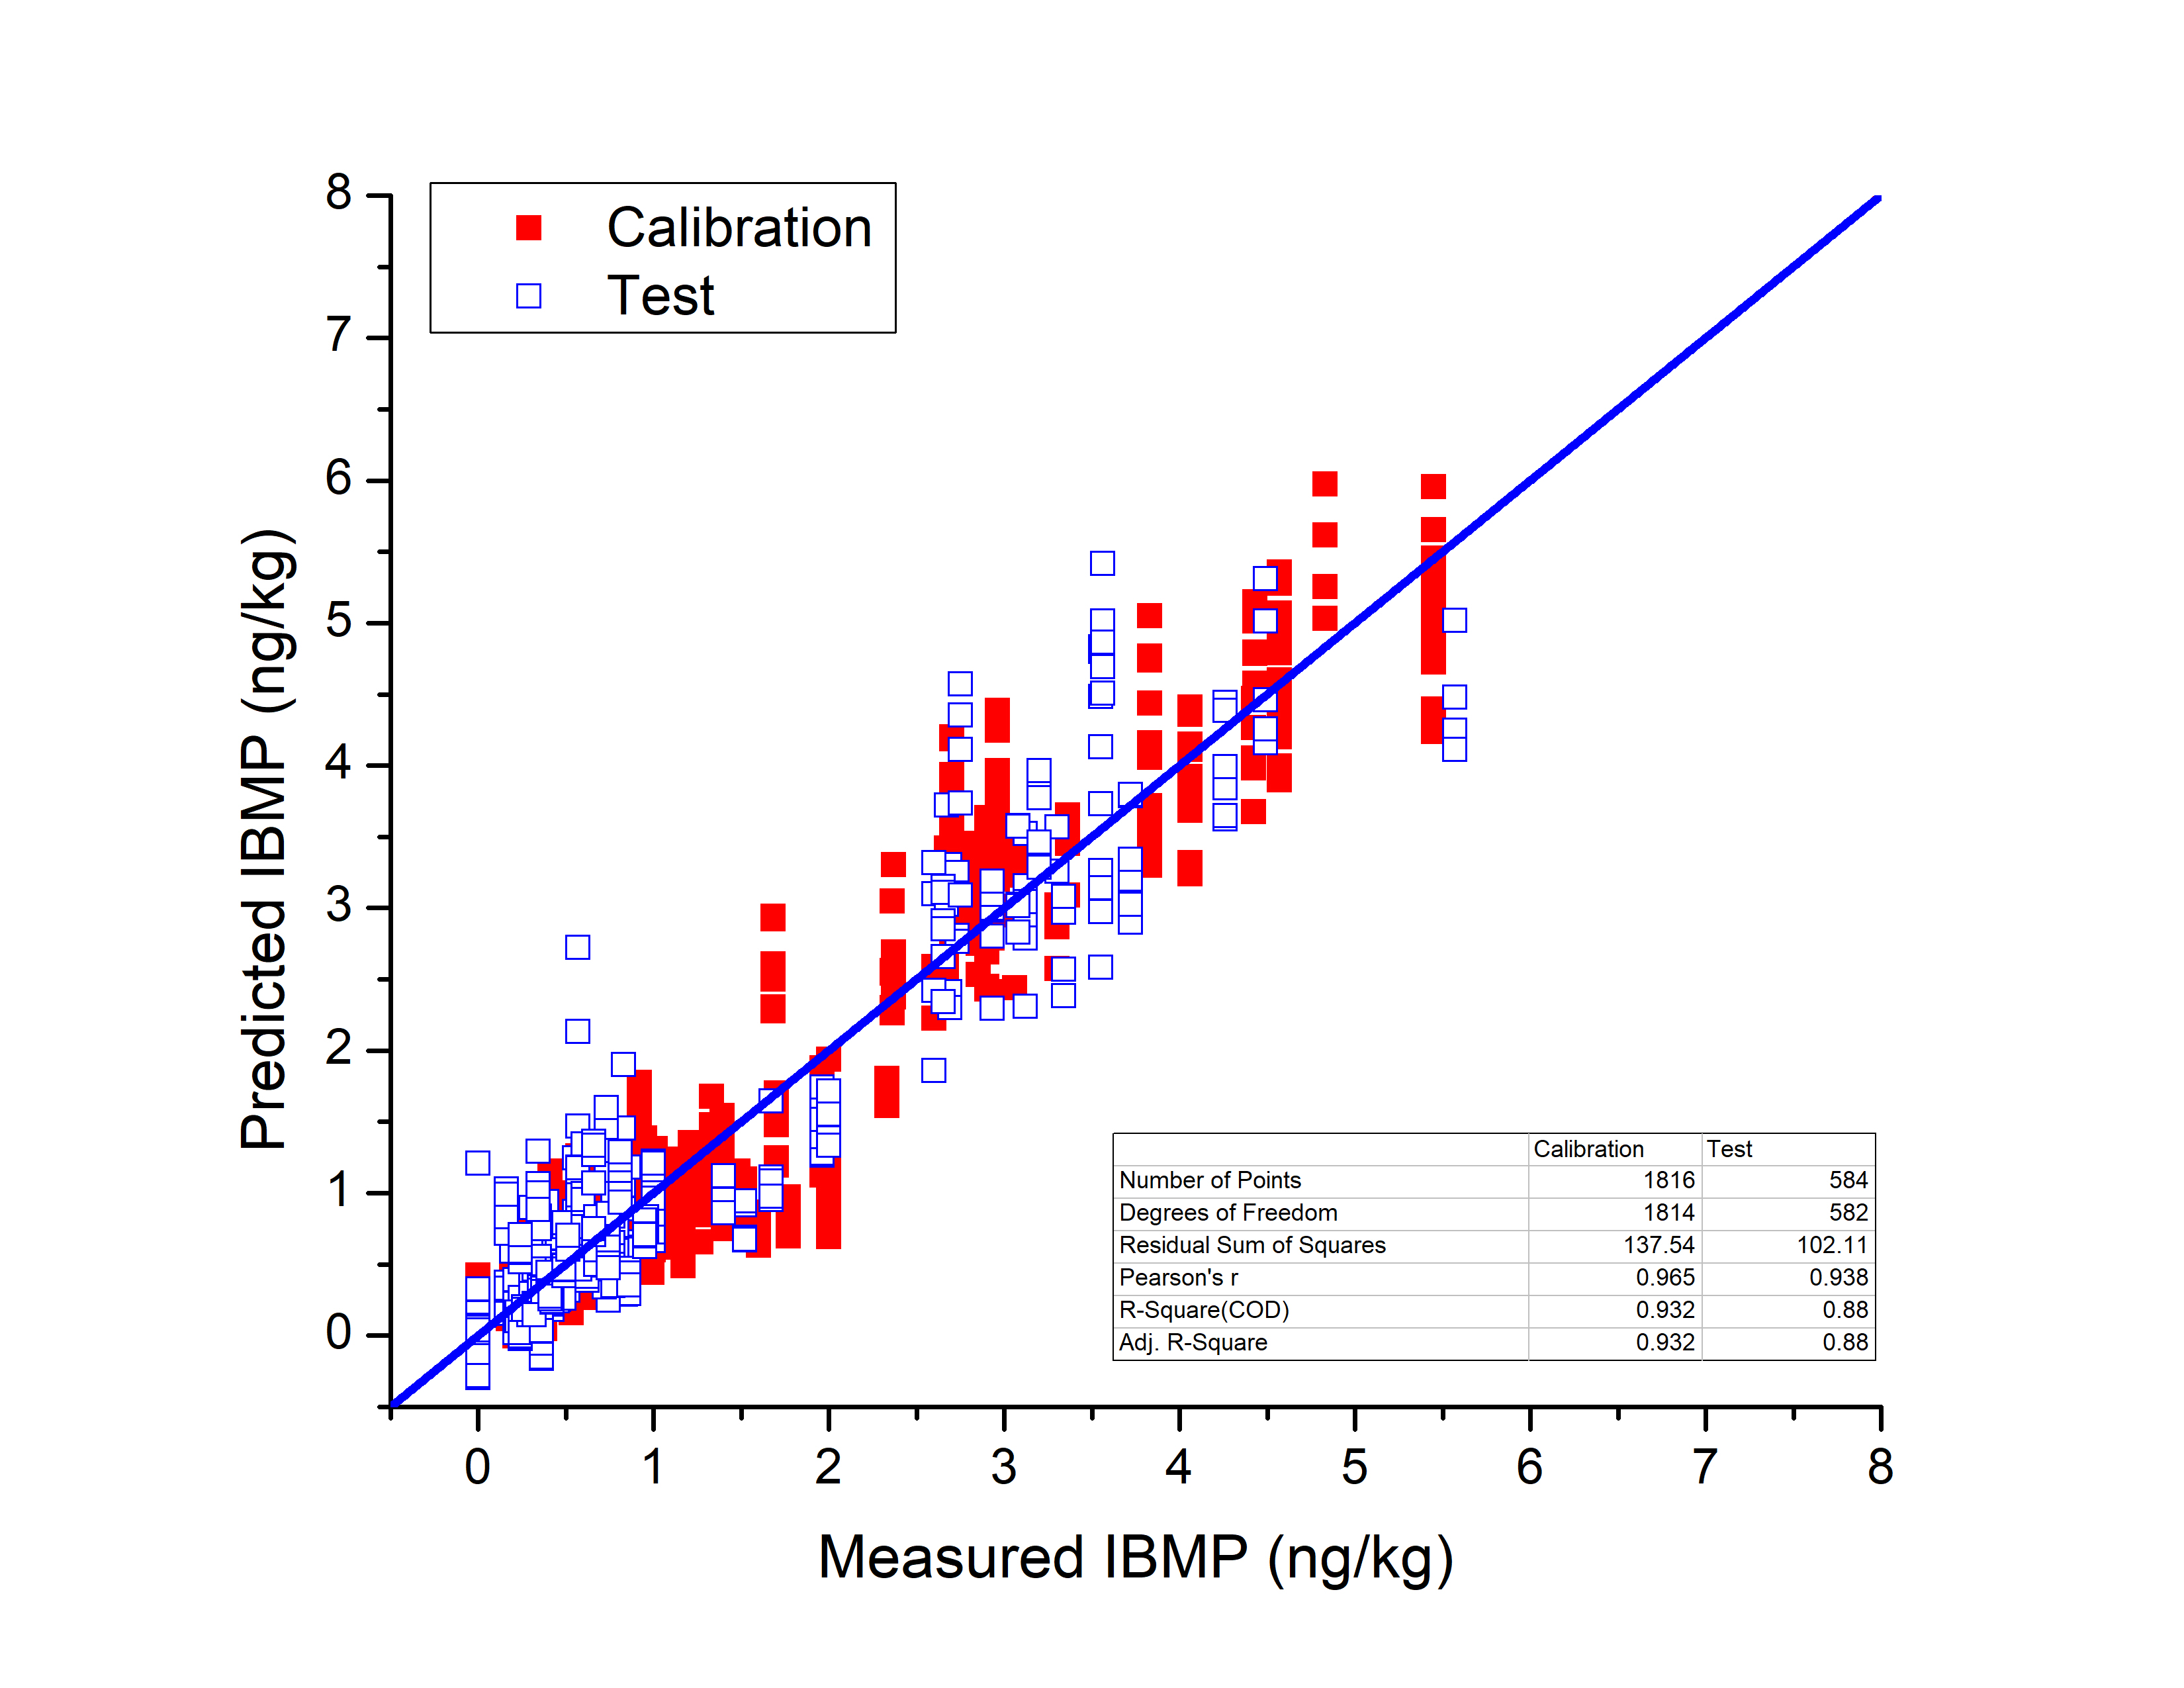
Figure 2. Linear regression plots of the measured IBMP concentration for the calibration (red) and test (blue) support vector machine models. The table inset shows the linear regression statistics. The model lines were plotted and evaluated with a constrained unity slope and intercept value of 0 as described in the text.
4. SVM discriminant analysis for grape classification according to IBMP level
IBMP is readily extracted from grapes during wine production, with concentrations measured in the grape extracts expected to be somewhat higher (typically around 30 %) than those in finished wine (Ryona et al., 2009). Furthermore, because reported sensory thresholds for IBMP in wine range from 2–16 ng/L and the SVM regression models yielded an LOD < 2 ng/kg, a two-class SVM discrimination model was developed and tested to classify when IBMP levels exceeded a 2 ng/kg threshold. The spectral calibration (CV) and test model variables (X-block) were maintained the same as for the regression modelling. Sample groups (including replicates) exceeding 2 ng/kg were assigned to one class whereas those less than 2 ng/kg were in the second class. Figure 3 shows the confusion matrix results for the test data set. Most notably, the true positive response (TPR) showed a score of 1 for all samples < 2 ng/kg and > 0.95 for samples > 2ng/kg. This indicated that the model can effectively discriminate grape extracts above and below this putative sensory threshold for IBMP in wine. The Matthews correlation coefficient was 0.970, with the number of false positive responses being 5 out of 584 samples, or less than 1 % of the test set size. These errors are consistent with the RMSE observed for the regression model when considering the concentration distribution in the 2 ng/kg region.
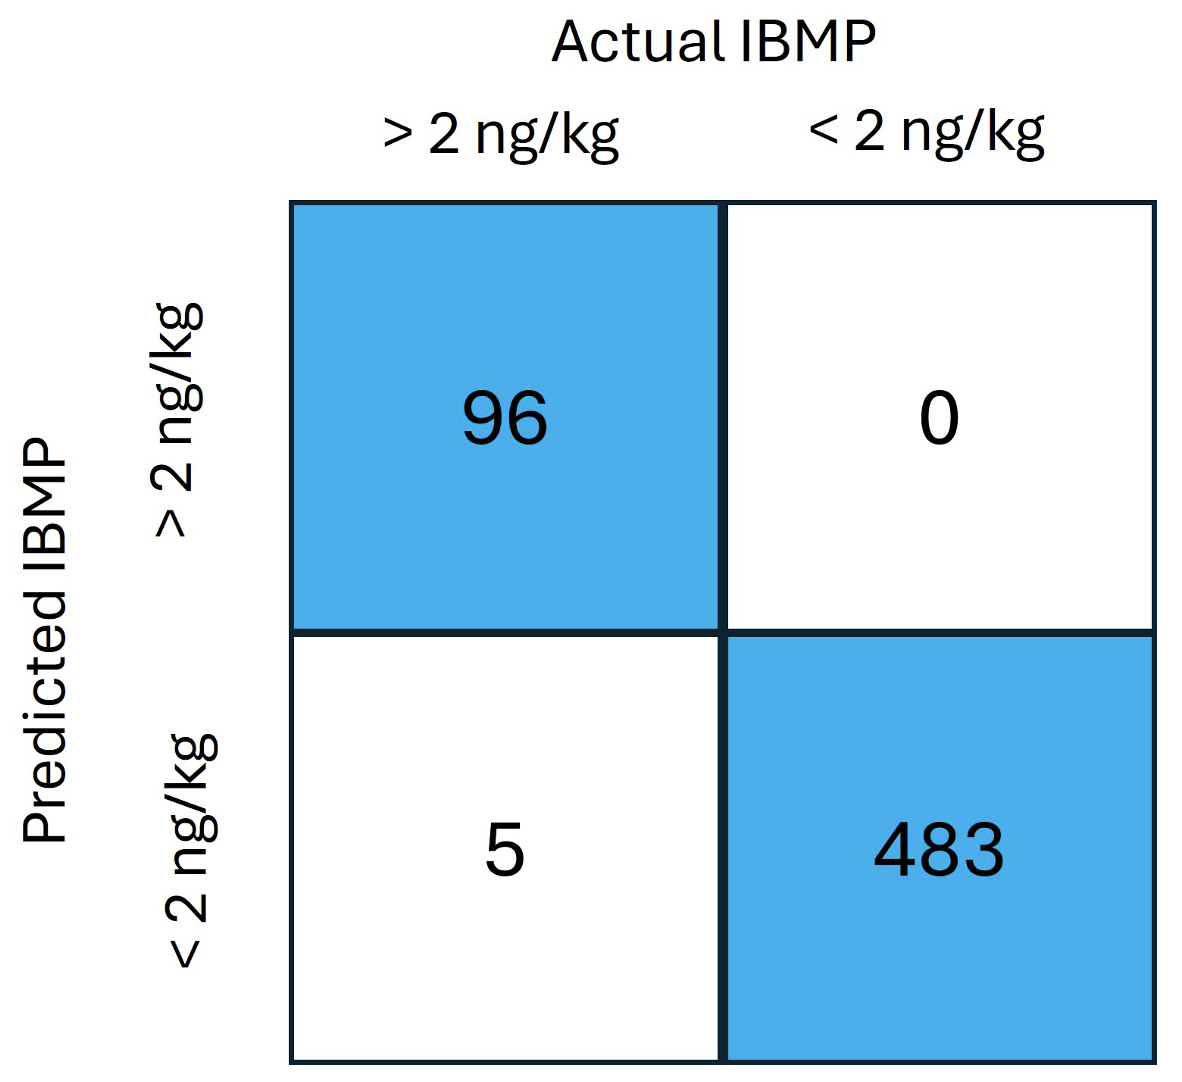
Figure 3. Confusion table for the IBMP test set evaluated using SVMDA. The figure compares the actual numbers of samples corresponding to the threshold criterion of 2 ng/kg shown along the top axis and the Predicted numbers of samples on the vertical axis. The complete confusion matrix is shown in Table S3.
5. Potential of the A-TEEM approach
The results from > 550 grape samples collected over four vintages have highlighted the capacity of the A-TEEM and SVM regression and discrimination to detect IBMP rapidly and sensitively in red winegrape extracts. IBMP detection by GC-MS and GC-MS/MS has reported LOD values of 1 and 0.13 ng/kg, respectively (Armstrong et al., 2021, Belancic & Agosin 2007, Sanders et al., 2023). Hence, the calculated A-TEEM detection limit of 1.32 ng/kg in the present work is functionally comparable when considering the reported sensory thresholds for IBMP in wine are ≥ 2 ng/L.
The A-TEEM and SVM combination yielded effective models for IBMP over the broad range of sampling sites, vintages, and grape varieties. Furthermore, the RMSE/LOD (0.4/1.32 ng/kg) values for the test models are lower (by almost 2-fold) than an earlier report involving A-TEEM for IBMP prediction in grape homogenate extracts. As described by Armstrong et al. (2023) in a study on Cabernet-Sauvignon grape maturity, partial least squares regression (classical linear approach) yielded a prediction RMSE and LOD of 1.24 and 4.09 ng/kg, respectively, whereas extreme gradient boosting regression (non-linear machine learning algorithm) yielded RMSE/LOD values of 0.74/2.44 ng/kg. The differences in detection limit are reminiscent of those seen with different SPME-GC-MS methods (which are univariate approaches), and in the case of A-TEEM with multivariate modelling, likely relate to the different grape samples and experimental conditions between the studies. In the work of Armstrong et al. (2023), grapes encompassed widely varying maturity levels and were sorted according to berry density, whereas grapes in the present study were analysed without sorting at harvest only. As indicated in that previous study, it is unlikely that IBMP would be directly contributing to true molecular fluorescence in the A-TEEM signals, but it is still captured in the molecular fingerprint of the samples, possibly through correlated compound signals. This could be another cause of the difference in sensitivity between the A-TEEM studies just discussed.
Although the LOD for the A-TEEM and SVM approach is fit for purpose, it is still higher compared to the most sensitive SPME-GC-MS/MS method employing deuterium labelled internal standards. Potential opportunities exist for improving A-TEEM sensitivity for IBMP in future analyses and surveys, noting that the A-TEEM method employed in this study was developed to provide a more general purpose fingerprint related to wine chemistry parameters and was not exclusively focused on nor optimised for IBMP. Thus, enhancements for IBMP determination may be approached methodologically, such as by reducing the excitation scanning range to focus on the most correlated variables in the A-TEEM’s UV region while better optimising the integration time. Additional sample repeats and replicates could also be measured without sacrificing considerable time. Finally, data analysis could conceivably be optimised by evaluating additional machine learning algorithms and pre-processing methods, which were beyond the scope of this study.
Conclusions
A-TEEM with machine learning modelling was shown to accurately predict and classify IBMP concentrations in red grape extracts below the reported wine sensory thresholds for this “green” character impact compound. It offers a rapid and sensitive approach to evaluating IBMP concentration in red grape samples that can conceivably be applied on a broad scale to support decision making. Future work to improve sampling and instrument conditions could serve to optimise A-TEEM analysis for IBMP prediction, with expansion of the models to include a broader varietal selection and a more complete scope of grape maturity and vineyard conditions. Moreover, the A-TEEM measurement and machine learning approach has significant potential to underpin more intensive studies and development of methods for determining not only methoxypyrazines but also other compositional or quality metrics in grapes or other products.
References
- Armstrong, C.E.J., Gilmore A.M., Boss, P.K., Pagay, V., & Jeffery, D.W. (2023). Machine learning for classifying and predicting grape maturity indices using absorbance and fluorescence spectra. Food Chemistry, 403(2):134321. https://doi.org/10.1016/j.foodchem.2022.134321
- Armstrong, C.E.J., Ristic, R., Boss, P.K., Pagay, V., & Jeffery, D.W. (2021). Effect of grape heterogeneity on wine chemical composition and sensory attributes for Vitis vinifera cv. Cabernet-Sauvignon. Australian Journal of Grape and Wine Research, 27, 206–218. https://doi.org/10.1111/ajgw.12469
- Belancic, A. & Agosin, E. (2007). Methoxypyrazines in grapes and wines of Vitis vinifera cv. Carménère. American Journal of Enology and Viticulture, 58(4), 462-469. https://doi.org/10.5344/ajev.2007.58.4.462
- Botezatu, A., Kotseridis, Y., Inglis, D., & Pickering, G.J. (2016). A survey of methoxypyrazines in wine. Journal of Food, Agriculture & Environment, 14 (1), 24-29. DOI: 10.1234/4.2016.1418.
- Cawley, G.C. & Talbot, N.L.C. (2010). On over-fitting in model selection and subsequent selection bias in performance evaluation. Journal of Machine Learning Research. 11, 2079-2107. https://doi.org/10.5555/1756006.1859921
- Gilmore, A.M. & Schober, D. (2025a). Analysis of grape and wine quality features with simultaneous absorbance and fluorescence technology. In: Practical quantitative vibrational and electronic spectroscopy: A guide for developing, optimizing, and validating procedures. John Wiley & Sons, Inc. Location: Hoboken, NJ, USA, Ed: Peru D. p. 231–256.
- Gilmore, A.M. & Schober, D. (2025b). Simultaneous absorbance and fluorescence instrument measuring and analysis principles for quantitative analysis. In: Practical quantitative vibrational and electronic spectroscopy: A guide for developing, optimizing, and validating procedures. John Wiley & Sons, Inc., Hoboken, NJ, USA, Ed: Peru D. p. 207–230.
- Romero, R., Chacón, J.L., García, E., & Martínez, J. (2006). Pyrazine contents in four red grape varieties cultivated in a warm climate. Journal international des sciences de la vigne et du vin, 40(4), 203-207. https://doi.org/10.20870/oeno-one.2006.40.4.861
- Ryona, I., Pan, B.S., & Sacks, G.L. (2009). Rapid measurement of 3-alkyl-2-methoxypyrazine content of winegrapes to predict levels in resultant wines. Journal of Agricultural and Food Chemistry, 57(18), 8250-8257. https://doi.org/10.1021/jf9019695
- Sanders, R.D., Boss, P.K., Capone, D.L., Kidman, C.M., Bramley, R.G.V., Nicholson, E.L., & Jeffery, D.W. (2022). Rootstock, vine vigour, and light mediate methoxypyrazines in the grape bunch rachis of Vitis vinifera L. cv. Cabernet-Sauvignon. Journal of Agricultural and Food Chemistry, 70(17), 5417–5426. https://doi.org/10.1021/acs.jafc.1c07978
- Sanders, R.D., Boss, P.K., Capone, D.L., Kidman, C.M., Nicholson, E.L., & Jeffery D.W. (2023). Distribution of 3-isobutyl-2-methoxypyrazine across rachis components of Vitis vinifera Shiraz and Cabernet-Sauvignon. Australian Journal of Grape and Wine Research, 2023, 2428791. https://doi.org/10.1155/2023/2428791
- Schober, D. Gilmore, A.M., Chen, L., Zincker, J., & Gonzalez, A. (2022). Determination of Cabernet-Sauvignon wine quality parameters in Chile by absorbance-transmission and fluorescence excitation emission matrix (A-TEEM) spectroscopy. Food Chemistry, 392, 133101. https://doi.org/10.1016/j.foodchem.2022.133101
 Views: 569
 XML: 74