

ENOLOGY / Short communications
Abstract
Mycorrhizal associations are increasingly recognized as modulators of grapevine physiology and secondary metabolism, yet their influence on aroma precursor formation under reduced fertilization remains insufficiently explored. This five-year field study investigated the effects of ecto mycorrhizal, arbuscular mycorrhizal, and combined inoculation on glycosidically bound and free volatile compounds in must and wine of Vitis vinifera ‘Danmarpa Polonia’ under reduced mineral fertilisation. Treatments were arranged in three biological replicates under rainfed conditions. Combined ectomycorrhizal and arbuscular inoculation significantly increased total free volatiles and glycosidically bound aroma precursors in must compared to the fully fertilised control. Wines produced from this treatment also exhibited significantly higher total volatile concentrations. Principal component analysis confirmed a clear separation of dual-inoculated vines from the control treatments. The results suggest that combined mycorrhizal inoculation under reduced fertilisation may enhance aromatic potential while supporting more sustainable viticultural practices.
Introduction
More than 80 % of plant species form mycorrhizal associations under natural conditions (Landi et al., 2021). In grapevines, arbuscular mycorrhiza (AM) is the best documented form of mycorrhizal association and is particularly relevant because grapevine roots have relatively low density and few root hairs (Landi et al., 2021; Svitlica et al., 2025). Arbuscular mycorrhizal fungi (AMF) are increasingly recognised as key components of sustainable viticulture because they enhance nutrient uptake, improve drought tolerance, and modulate plant physiological responses and health (Trouvelot et al., 2015; Torres et al., 2018; Viret & Gindro, 2025). By contrast, ectomycorrhizal-type inocula have been much less studied in grapevine, and their use requires cautious interpretation, especially when root colonisation is not directly verified. Mycorrhizal symbiosis has been shown to modify root architecture, increase phosphorus, potassium, and calcium acquisition and influence overall vine growth and productivity (Schreiner, 2007; Cangahuala-Inocente et al., 2011; Nicolas et al., 2015; Martín et al., 2017). Field studies have further demonstrated improvements in berry quality and antioxidant properties following AMF inoculation (Nogales et al., 2009; Torres et al., 2016). In cultivated grapevines, some fungi may also influence the flavour, colour and quality of the final product (Gilbert et al., 2014). In Karoglan et al. (2021), inoculated grapevines generally showed improved leaf gas-exchange parameters and higher yield parameters, particularly the number of clusters per vine. Moreover, mycorrhizal fungi increased total flavan-3-ols, total anthocyanins and total polyphenols in berry skins.
According to Schreiner (2020), grapevine roots in the field are colonised simultaneously by multiple AMF species. In vineyards, the AMF communities mainly belong to the order Glomerales, phylum Glomeromycota (Likar et al., 2013; Trouvelot et al., 2015; Massa et al., 2020). The effectiveness of mycorrhizal symbiosis in grapevines depends on the strain of mycorrhizal fungus, grapevine characteristics, soil type, and their interaction (Jackson, 2020). According to Schreiner (2003), the differences in the colonisation of mycorrhizal fungi on grapevines depend on the variety, grapevine rootstock, and the vine load. Radić et al. (2021) note that vineyard management practices can significantly change, and often reduce, the taxonomic and/or functional soil microbiome through fertilisation, tillage, and chemical plant protection.
Furthermore, root-associated fungal communities in wild grapevines remain underexplored (Arnold et al., 1998). Only a few reports describe colonisation by arbuscular mycorrhizal fungi (Radić et al., 2018) and the diversity of mycorrhizal spores in rhizosphere soil (Ocete et al., 2015). Radić et al. (2021) showed that wild grapevines from four protected and/or natural habitats in Croatia and in Bosnia and Herzegovina were associated with a wide range of taxonomically and functionally different root-associated fungi. Most fungal taxa were assigned to the main ecological niches: pathotrophs, symbiotrophs, saprotrophs, and endophytes. Many of these belonged to more than one ecological category. To our knowledge, published evidence for true ectomycorrhizal root colonisation in grapevine remains lacking.
Therefore, interpret the ectomycorrhizal treatment in the present study cautiously. Grapevine is primarily associated with arbuscular mycorrhizal fungi, whereas evidence for true ectomycorrhizal colonisation of Vitis roots remains limited. In this study, the ECM treatment refers to a commercial inoculum containing ectomycorrhizal fungal isolates and selected basidiomycetes, applied according to the producer's recommendation. Thus, this treatment was included as a practical inoculation variant rather than as direct evidence of established ectomycorrhizal symbiosis in grapevine.
Beyond these well-documented effects on plant nutrition and vegetative development, increasing evidence suggests that mycorrhizal associations may influence grapevine secondary metabolism. Proteomic and physiological studies indicate that AMF can modulate metabolic pathways beyond phosphorus uptake, potentially affecting phenylpropanoid and terpenoid biosynthesis (Cangahuala-Inocente et al., 2011; Trouvelot et al., 2015). Volatile organic compounds (VOCs) in grapevine originate mainly from the lipoxygenase (LOX), shikimate and terpenoid (MVA/MEP) pathways and play a central role in varietal aroma formation and plant defence responses (Dudareva et al., 2006; Schwab et al., 2008). Importantly, many aroma-related compounds occur not only in their free form but also as glycosidically bound conjugates, which act as non-volatile reservoirs of aroma potential. These glycosides can be enzymatically hydrolysed during fermentation and ageing, releasing odour-active monoterpenes and norisoprenoids that shape the wine's final aromatic profile (Gunata et al., 1985; Sefton et al., 1993; Mateo & Jiménez, 2000; Dziadas & Jeleń, 2016). The formation of monoterpene glycosides in grapevine tissues is mediated by specific UDP-glycosyltransferases (UGTs), including members of the UGT85A family (Bönisch et al., 2014; Caputi et al., 2011). Microbial interactions in the rhizosphere, including mycorrhizal associations, have been reported to alter terpene biosynthesis and volatile composition in grapevine tissues (Salomon et al., 2014; Velásquez et al., 2020). Although glycosidically bound aroma precursors have been widely characterised in grapes (Gunata et al., 1985; Mateo & Jiménez, 2000), their response to mycorrhizal inoculation under reduced fertilisation regimes remains insufficiently explored. In particular, little is known about the combined effects of ectomycorrhizal and arbuscular inoculation on volatile accumulation in field-grown grapevines.
Therefore, this study aimed to evaluate the effects of ectomycorrhizal, arbuscular mycorrhizal, and dual inoculation under reduced mineral fertilisation on free and glycosidically bound volatile compounds in must and wine from Vitis vinifera ‘Danmarpa Polonia’.
Materials and methods
The study was conducted under rainfed field conditions from November 2018 to August 2023 at the Experimental Station of the Department of Ornamental Plants, Dendrology and Orchards, University of Life Sciences in Poznań, Poland (52.4091° N, 16.8630° E; 85 m a.s.l.). We established a five-year field experiment and collected grape samples for volatile and glycosidically bound aroma analyses in the third and fourth years after planting, corresponding to the 2021 and 2022 growing seasons. The 2023 season was not included in the volatile-compound analysis because the plants were severely affected by grapevine powdery mildew (Erysiphe necator) under the field trial's low-intervention management conditions, which prevented a representative fruit harvest.
The region has a temperate climate typical of western Poland, with moderately warm summers and cool winters. Long-term climatic records indicate a mean annual precipitation of 550–600 mm and a mean annual air temperature of 8.5–9.0 °C. The vineyard was not irrigated and relied exclusively on natural rainfall.
Monthly precipitation, mean air temperature and solar irradiation recorded during the experimental period are presented in Figure 1, illustrating the pronounced seasonal variability characteristic of the Wielkopolska region.
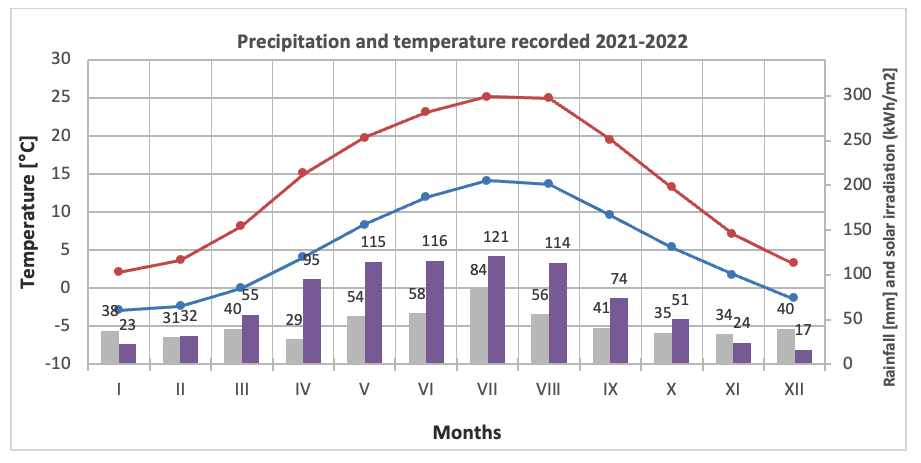
Figure 1. Mean monthly precipitation, solar irradiation, and air temperature for the 2021 and 2022 growing seasons. Grey bars represent mean monthly precipitation (mm), while purple bars indicate mean monthly solar irradiation (kWh m-2). Lines represent mean monthly maximum (orange) and minimum (blue) air temperatures (°C).
The field experiment used Vitis vinifera ‘Danmarpa Polonia’ (Figure 2), cultivated in three rows. 'Danmarpa Polonia' is a Polish grapevine selection closely related to the Hungarian table-grape cultivar 'Pannonia Kincse'/'Skarb Panonii' (Vitis vinifera L.; VIVC No. 8915). Previous ISSR-based analysis did not differentiate 'Danmarpa Polonia' from 'Pannonia Kincse' using the applied molecular markers, indicating a very close genetic relationship between these accessions. In the present study, the material was therefore described under its local denomination, 'Danmarpa Polonia'. At the time of the experiment, this selection was under preliminary evaluation and was not listed as a standard OIV cultivar entry under this name "Hajdu E. and Borbasne Sasköi E., 2003" (Hajdu & Borbasne Sasköi, 2003).
Each treatment combination included three replicates with eight plants per replicate, a total of 120 plants. The vines were trained on a three-wire trellis system with wires positioned at heights of 70, 130, and 200 cm. The spacing between rows (replicates) was 4 m, and between plants within each row was 1 m. Each treatment block within a replicate was separated by a 2 m buffer zone. Five treatment combinations were established: (A) ectomycorrhizal inoculation, (B) arbuscular mycorrhizal (endomycorrhizal) inoculation, (C) combined ectomycorrhizal and arbuscular mycorrhizal inoculation, (D) full mineral fertilisation (control), (E) reduced fertilisation control (50 % mineral fertilisation, no inoculation).
The mycorrhizal inoculants were commercial preparations supplied by Mykoflor (Poland) and were applied according to the producer’s recommendations.
The ectomycorrhizal inoculum contained fungal isolates obtained from grapevine roots collected from natural habitats and from vines established in a deciduous forest, together with selected ectomycorrhizal basidiomycetes, including Boletus edulis, Boletus erythropus, and Xerocomus chrysenteron, according to the producer’s information. The arbuscular mycorrhizal inoculum contained Rhizophagus intraradices (formerly Glomus intraradices), Glomus claroideum, Glomus etunicatum, Glomus fasciculatum, Gigaspora sp., and Entrophospora sp. Control plants were immersed in pure hydrogel without fungal inoculum.
The use of commercial preparations provided by the producer was intended to ensure inoculum viability; however, root colonisation was not independently quantified in the present study by microscopic or molecular methods. For all inoculated treatments (A–C), mineral fertilisation was reduced by 50 % compared to the standard fertilisation treatment (D). Detailed procedures for plant propagation, mycorrhizal inoculation, fertilisation, vinification, SPE extraction, enzymatic hydrolysis, GC–MS analysis, compound identification, semi-quantification and statistical treatment are provided in the Supplementary Materials.
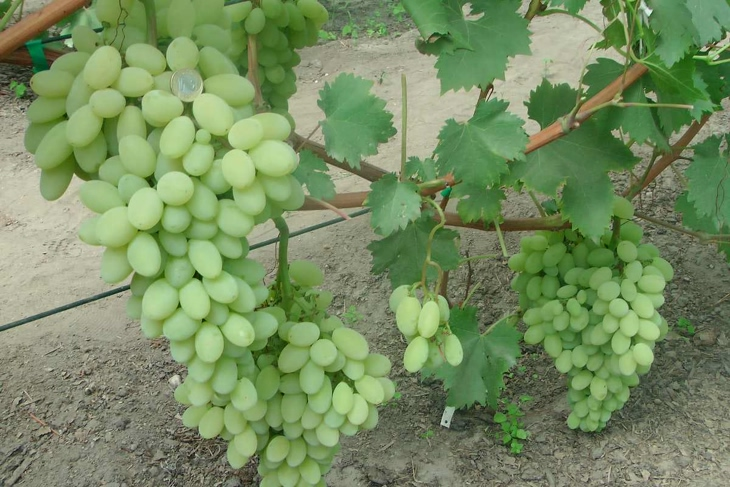
Figure 2. Vitis vinifera ‘Danmarpa Polonia’
Results and discussion
In grape musts from the 2021 season, nine free volatile compounds were identified, comprising two C6 aldehydes, three C6 alcohols, and four monoterpene alcohols (Table 1). Based on semi-quantitative concentration equivalents, the compounds contributing most to the total free volatile pool in musts were 1-hexanol, (E)-3-hexen-1-ol, (E)-2-hexen-1-ol, and geraniol, although their relative abundances varied markedly among treatments.
The highest total abundance of free volatiles in musts was observed in treatment C (combined ecto- and arbuscular mycorrhizal inoculation), followed by treatments B and A, while the fully fertilised control (D) exhibited the lowest total signal intensity. Treatment E showed a relatively low total abundance, exceeding only the fully fertilised control D.
Compound | A | B | C | D | E | BH-adjusted p-value |
hexanal | 8.11 ± 1.72 bc | 12.36 ± 2.50 a | 8.81 ± 1.91 bc | 5.80 ± 1.09 c | 10.79 ± 1.25 ab | <0.001 |
(E)-2-hexenal | 0.14 ± 0.05 c | 11.33 ± 1.73 a | 1.84 ± 0.86 b | 0.14 ± 0.10 c | 0.70 ± 0.30 bc | <0.001 |
1-hexanol | 38.18 ± 5.65 a | 40.67 ± 7.56 a | 35.73 ± 3.67 a | 1.30 ± 0.63 b | 0.72 ± 0.19 b | <0.001 |
(E)-3-hexen-1-ol | 3.59 ± 1.19 b | 5.31 ± 1.46 b | 78.48 ± 8.39 a | 1.64 ± 1.14 b | 4.52 ± 2.44 b | <0.001 |
(E)-2-hexen-1-ol | 11.08 ± 1.56 b | 15.01 ± 2.87 a | 6.20 ± 0.58 c | 7.05 ± 1.85 c | 7.00 ± 0.67 c | <0.001 |
α-terpineol | 0.18 ± 0.06 c | 0.69 ± 0.22 a | 0.24 ± 0.10 bc | 0.11 ± 0.06 c | 0.53 ± 0.11 ab | <0.001 |
citronellol | 0.21 ± 0.06 c | 3.27 ± 0.60 a | 0.68 ± 0.17 b | 0.06 ± 0.03 c | 0.49 ± 0.11 bc | <0.001 |
nerol | 2.44 ± 0.67 b | 0.61 ± 0.17 d | 3.56 ± 0.64 a | 1.65 ± 0.66 c | 3.27 ± 0.87 ab | <0.001 |
geraniol | 13.29 ± 1.28 b | 6.58 ± 1.83 c | 23.01 ± 2.79 a | 4.78 ± 1.31 c | 4.74 ± 1.00 c | <0.001 |
Different letters within a row indicate significant differences between treatments according to Tukey’s HSD test (p < 0.05). Letters indicate the results of Tukey’s HSD pairwise comparisons based on the unadjusted compound-level ANOVA, whereas the final significance of the overall treatment effect was evaluated using BH-adjusted p-values. Values are presented as mean ± standard deviation (n = 3). BH-adjusted p-values were calculated from one-way ANOVA p-values using the Benjamini–Hochberg false discovery rate procedure across all 33 compound-level tests reported for the 2021 season in Tables 1, 3, and 5.
In grape musts from the 2022 season, nine free volatile compounds were identified, comprising two C6 aldehydes, three C6 alcohols, and four monoterpene alcohols (Table 2). Based on the semi-quantitative concentration equivalents, the compounds contributing most strongly to the free volatile pool were (E)-3-hexen-1-ol, 1-hexanol, geraniol, hexanal, and (E)-2-hexen-1-ol, although their relative contributions differed substantially among treatments. All identified compounds showed significant treatment-dependent differences after Benjamini–Hochberg correction (adjusted p < 0.001).
Compound | A | B | C | D | E | BH-adjusted p-value |
hexanal | 11.67 ± 2.34 ab | 16.16 ± 5.34 a | 15.20 ± 2.75 a | 3.95 ± 0.50 c | 7.27 ± 0.85 bc | <0.001 |
(E)-2-hexenal | 0.23 ± 0.10 c | 2.51 ± 0.79 b | 5.50 ± 0.46 a | 0.51 ± 0.10 c | 0.21 ± 0.03 c | <0.001 |
1-hexanol | 13.57 ± 1.44 b | 33.09 ± 8.78 a | 24.86 ± 3.06 a | 2.10 ± 0.60 c | 0.94 ± 0.08 c | <0.001 |
(E)-3-hexen-1-ol | 1.16 ± 0.19 b | 5.11 ± 1.01 b | 51.25 ± 8.82 a | 2.09 ± 0.25 b | 4.21 ± 0.88 b | <0.001 |
(E)-2-hexen-1-ol | 9.61 ± 1.72 b | 13.34 ± 1.78 a | 7.06 ± 1.23 bc | 3.03 ± 0.54 d | 6.41 ± 0.87 c | <0.001 |
α-terpineol | 0.26 ± 0.11 bc | 0.48 ± 0.10 a | 0.40 ± 0.08 ab | 0.20 ± 0.06 c | 0.49 ± 0.04 a | <0.001 |
citronellol | 0.13 ± 0.04 c | 2.30 ± 0.37 b | 3.30 ± 0.62 a | 0.04 ± 0.01 c | 0.43 ± 0.07 c | <0.001 |
nerol | 0.66 ± 0.34 c | 0.20 ± 0.03 c | 5.64 ± 0.56 a | 0.20 ± 0.03 c | 2.64 ± 0.87 b | <0.001 |
geraniol | 8.24 ± 1.11 b | 3.68 ± 0.72 c | 27.93 ± 3.72 a | 4.20 ± 0.88 c | 4.44 ± 0.69 bc | <0.001 |
Different letters within a row indicate significant pairwise differences between treatments according to Tukey’s HSD test (p < 0.05). Tukey groupings were based on individual compound-level analyses, whereas the statistical significance of the overall treatment effect was determined using BH-adjusted ANOVA p-values. Values are presented as mean ± standard deviation (n = 3). BH-adjusted p-values were calculated from one-way ANOVA p-values using the Benjamini–Hochberg false discovery rate procedure across all 33 compound-level tests reported for the 2022 season in Tables 2, 4, and 6.
The highest total abundance of free volatiles was recorded in treatment C, reaching approximately 141.14 µg L-1 equivalents, followed by treatments B, A, E, and D, with corresponding totals of 76.87, 45.53, 27.04, and 16.32 µg L-1 equivalents, respectively. Treatment C was particularly characterised by high concentrations of (E)-3-hexen-1-ol and geraniol, which reached 51.25 and 27.93 µg L-1 equivalents, respectively. It also contained the highest concentrations of (E)-2-hexenal, citronellol, and nerol. Treatment B showed the highest mean concentrations of 1-hexanol and (E)-2-hexen-1-ol, although its 1-hexanol concentration did not differ significantly from that observed in treatment C. In contrast, the fully fertilised control D exhibited the lowest overall volatile abundance, while treatment E showed intermediate-to-low concentrations for most compounds.
After enzymatic hydrolysis, six volatile aglycones were consistently released from glycosidically bound aroma precursors in must samples, comprising three C6 alcohols–1-hexanol, (E)-3-hexen-1-ol, and (E)-2-hexen-1-ol–and three monoterpene alcohols–α-terpineol, citronellol, and geraniol (Table 3).
Compound | A | B | C | D | E | BH-adjusted p-value |
1-hexanol | 2.70 ± 0.32 c | 5.90 ± 1.80 b | 14.90 ± 3.10 a | 6.10 ± 0.70 b | 2.90 ± 0.45 c | <0.001 |
(E)-3-hexen-1-ol | 3.30 ± 0.40 c | 6.80 ± 1.90 b | 17.60 ± 3.40 a | 6.90 ± 0.80 b | 3.60 ± 0.55 c | <0.001 |
(E)-2-hexen-1-ol | 3.10 ± 0.36 c | 6.20 ± 1.70 b | 16.10 ± 2.90 a | 6.50 ± 0.70 b | 3.20 ± 0.48 c | <0.001 |
α-terpineol | 3.50 ± 0.42 c | 7.40 ± 1.10 b | 17.90 ± 3.30 a | 6.80 ± 0.80 b | 3.50 ± 0.50 c | <0.001 |
citronellol | 2.90 ± 0.34 c | 6.50 ± 0.90 b | 15.50 ± 3.10 a | 6.20 ± 0.70 b | 3.00 ± 0.46 c | <0.001 |
geraniol | 3.10 ± 0.38 c | 6.60 ± 0.90 b | 15.80 ± 3.20 a | 7.10 ± 0.90 b | 3.40 ± 0.52 c | <0.001 |
Different letters within a row indicate significant differences between treatments according to Tukey’s HSD test (p < 0.05). Letters indicate the results of Tukey’s HSD pairwise comparisons based on the unadjusted compound-level ANOVA, whereas the final significance of the overall treatment effect was evaluated using BH-adjusted p-values. Values are presented as mean ± standard deviation (n = 3). BH-adjusted p-values were calculated from one-way ANOVA p-values using the Benjamini–Hochberg false discovery rate procedure across all 33 compound-level tests reported for the 2021 season in Tables 1, 3, and 5.
The total concentration equivalents of volatile aglycones released after enzymatic hydrolysis differed substantially among treatments. The highest mean values were recorded for treatment C, whereas treatments B and D showed intermediate levels. The lowest total concentration equivalents of released volatile aglycones were recorded in treatments A and E. These results indicate treatment-dependent differences in the pool of aroma precursors present in grape musts.
After enzymatic hydrolysis, six volatile aglycones were released from glycosidically bound aroma precursors in grape musts collected in the 2022 season, comprising three C6 alcohols and three monoterpene alcohols (Table 4). All compounds showed significant treatment-dependent differences after Benjamini–Hochberg correction (adjusted p < 0.001).
Compound | A | B | C | D | E | BH-adjusted p-value |
1-hexanol | 1.13 ± 0.25 d | 8.21 ± 1.12 b | 11.61 ± 0.93 a | 3.76 ± 0.79 c | 2.53 ± 0.48 cd | <0.001 |
(E)-3-hexen-1-ol | 2.69 ± 0.30 c | 4.07 ± 0.44 b | 12.65 ± 1.13 a | 2.72 ± 0.29 c | 1.33 ± 0.08 d | <0.001 |
(E)-2-hexen-1-ol | 1.55 ± 0.27 c | 4.70 ± 0.79 b | 10.10 ± 0.91 a | 1.48 ± 0.28 c | 1.92 ± 0.57 c | <0.001 |
α-terpineol | 1.70 ± 0.37 b | 2.39 ± 0.51 b | 5.54 ± 1.51 a | 1.53 ± 0.24 b | 1.03 ± 0.14 b | <0.001 |
citronellol | 0.85 ± 0.10 c | 1.62 ± 0.51 bc | 4.84 ± 0.71 a | 1.74 ± 0.31 bc | 1.90 ± 0.20 b | <0.001 |
geraniol | 1.61 ± 0.22 b | 2.05 ± 0.53 b | 6.29 ± 0.83 a | 1.71 ± 0.34 b | 1.27 ± 0.12 b | <0.001 |
Different letters within a row indicate significant pairwise differences between treatments according to Tukey’s HSD test (p < 0.05). Tukey groupings were based on individual compound-level analyses, whereas the statistical significance of the overall treatment effect was determined using BH-adjusted ANOVA p-values. Values are presented as mean ± standard deviation (n = 3). BH-adjusted p-values were calculated from one-way ANOVA p-values using the Benjamini–Hochberg false discovery rate procedure across all 33 compound-level tests reported for the 2022 season in Tables 2, 4, and 6.
The total concentration equivalents of released aroma compounds were highest in treatment C (51.03 µg L-1 equivalents), followed by treatment B (23.04 µg L-1 equivalents). Treatments D, E, and A showed substantially lower total values of 12.94, 9.98, and 9.53 µg L-1 equivalents, respectively. Treatment C exhibited the highest mean concentration of every compound analysed, particularly (E)-3-hexen-1-ol, 1-hexanol, and (E)-2-hexen-1-ol, which reached 12.65, 11.61, and 10.10 µg L-1 equivalents, respectively. Treatment B generally represented the second-highest level of glycosidically bound aroma compounds, with particularly high concentrations of 1-hexanol and (E)-2-hexen-1-ol. Treatment D showed intermediate-to-low concentrations, whereas treatments A and E had the lowest overall pools of released aroma compounds. Nevertheless, some compound-specific differences were observed between these treatments, particularly for citronellol and (E)-3-hexen-1-ol. Overall, the results confirm a pronounced treatment effect on the glycosidically bound aroma precursor pool, with the combined inoculation treatment C producing the greatest abundance of potentially releasable aroma compounds.
In wines, 18 volatile compounds were identified, representing esters, higher alcohols, fatty acids, and phenolic derivatives (Table 5). Based on semi-quantitative concentration equivalents, the main contributors to the total volatile pool were octanoic acid, 2-phenylethanol, ethyl octanoate, decanoic acid, ethyl hexanoate, and isoamyl acetate.
Compound | A | B | C | D | E | BH-adjusted p-value |
isoamyl acetate | 34.06 ± 2.36 b | 46.67 ± 3.89 b | 76.21 ± 10.45 a | 49.01 ± 5.76 b | 34.64 ± 7.53 b | <0.001 |
isoamyl alcohol | 37.47 ± 4.39 a | 43.54 ± 5.23 a | 26.46 ± 3.02 b | 35.55 ± 2.48 a | 45.81 ± 3.46 a | <0.001 |
ethyl hexanoate | 43.69 ± 3.66 b | 45.16 ± 4.08 b | 59.19 ± 6.82 a | 53.83 ± 3.94 a | 41.73 ± 3.45 b | <0.001 |
hexyl acetate | 6.67 ± 0.48 c | 8.97 ± 0.58 b | 14.40 ± 1.15 a | 10.20 ± 0.59 b | 7.92 ± 0.46 c | <0.001 |
1-hexanol | 43.72 ± 2.14 a | 36.04 ± 1.41 a | 19.68 ± 0.29 b | 35.31 ± 3.24 a | 39.60 ± 5.69 a | <0.001 |
ethyl octanoate | 76.35 ± 5.65 b | 71.97 ± 4.66 b | 101.19 ± 10.62 a | 84.32 ± 9.53 ab | 79.74 ± 5.29 b | <0.001 |
ethyl decanoate | 18.86 ± 1.38 b | 20.71 ± 3.94 b | 32.27 ± 2.51 a | 23.27 ± 3.18 b | 26.03 ± 2.17 ab | <0.001 |
diethyl succinate | 6.26 ± 0.40 a | 3.58 ± 0.37 bc | 3.12 ± 0.42 c | 4.33 ± 0.34 b | 5.44 ± 0.33 a | <0.001 |
ethyl 9-decenoate | 3.08 ± 0.17 ab | 3.33 ± 0.17 a | 2.19 ± 0.06 c | 3.00 ± 0.03 b | 3.14 ± 0.24 ab | <0.001 |
citronellol | 1.37 ± 0.21 ab | 1.79 ± 0.69 a | 1.29 ± 0.25 b | 1.19 ± 0.25 b | 1.19 ± 0.01 b | 0.045 |
2-phenylethyl acetate | 8.15 ± 0.42 d | 19.13 ± 2.37 b | 26.77 ± 2.89 a | 16.78 ± 2.21 bc | 13.59 ± 0.83 c | <0.001 |
β-damascenone | 13.10 ± 1.04 a | 3.71 ± 0.99 c | 7.14 ± 0.31 b | 0.77 ± 0.01 d | 0.53 ± 0.01 d | <0.001 |
geraniol | 0.73 ± 0.03 b | 0.93 ± 0.05 b | 1.56 ± 0.95 a | 1.03 ± 0.46 b | 0.84 ± 0.24 b | 0.056 |
hexanoic acid | 12.90 ± 2.87 b | 13.25 ± 2.55 b | 23.34 ± 2.70 a | 1.02 ± 0.14 c | 15.60 ± 1.82 b | <0.001 |
2-phenylethanol | 67.57 ± 9.97 c | 136.34 ± 19.67 a | 86.86 ± 4.80 bc | 60.09 ± 5.78 c | 109.89 ± 10.99 b | <0.001 |
octanoic acid | 231.33 ± 35.45 b | 240.87 ± 36.54 b | 407.06 ± 34.65 a | 55.21 ± 5.10 c | 277.30 ± 34.21 b | <0.001 |
2-methoxy-4-vinylphenol | 1.18 ± 0.25 ab | 1.31 ± 0.10 a | 0.85 ± 0.04 c | 1.27 ± 0.16 a | 1.09 ± 0.26 b | 0.002 |
decanoic acid | 50.65 ± 8.19 c | 33.77 ± 3.86 d | 113.68 ± 20.78 a | 68.20 ± 8.12 bc | 81.87 ± 10.93 b | <0.001 |
Different letters within a row indicate significant differences between treatments according to Tukey’s HSD test (p < 0.05). Letters indicate the results of Tukey’s HSD pairwise comparisons based on the unadjusted compound-level ANOVA, whereas the final significance of the overall treatment effect was evaluated using BH-adjusted p-values. Values are presented as mean ± standard deviation (n = 3). BH-adjusted p-values were calculated from one-way ANOVA p-values using the Benjamini–Hochberg false discovery rate procedure across all 33 compound-level tests reported for the 2021 season in Tables 1, 3, and 5.
The total abundance of volatile compounds varied markedly among treatments. Wines produced from grapes subjected to combined mycorrhizal inoculation (C) exhibited the highest total volatile signal, whereas the fully fertilised control (D) showed the lowest overall abundance. Treatments A, B, and E displayed intermediate values.
Treatment C generally exhibited higher concentrations of several fruity esters than the non-inoculated controls, whereas treatments A and B did not show a consistent increase across all ester compounds. After Benjamini–Hochberg correction, significant treatment effects were retained for 17 of the 18 compounds. Geraniol was the only compound that did not remain significant at the FDR-adjusted threshold of 0.05.
In wines from the 2022 season, 18 volatile compounds were identified, representing esters, higher alcohols, fatty acids, monoterpenes, and phenolic derivatives (Table 6). Based on semi-quantitative concentration equivalents, the major contributors to the total volatile pool were octanoic acid, 2-phenylethanol, ethyl octanoate, decanoic acid, ethyl hexanoate, and isoamyl acetate.
Compound | A | B | C | D | E | BH-adjusted p-value |
isoamyl acetate | 37.63 ± 2.98 abc | 35.71 ± 10.33 bc | 52.57 ± 3.66 a | 32.03 ± 5.03 c | 48.38 ± 8.95 ab | 0.003 |
isoamyl alcohol | 30.26 ± 3.84 b | 35.02 ± 5.95 ab | 45.38 ± 4.43 a | 28.04 ± 9.36 b | 39.56 ± 5.20 ab | 0.007 |
ethyl hexanoate | 38.70 ± 8.12 bc | 51.19 ± 5.49 ab | 61.92 ± 6.19 a | 35.49 ± 6.07 c | 50.39 ± 8.24 abc | <0.001 |
hexyl acetate | 5.08 ± 1.05 d | 8.36 ± 1.53 bc | 11.03 ± 1.09 a | 6.05 ± 1.10 cd | 8.96 ± 1.00 ab | <0.001 |
1-hexanol | 27.82 ± 7.04 bc | 35.28 ± 6.76 bc | 68.95 ± 4.23 a | 21.69 ± 7.17 c | 39.91 ± 5.48 b | <0.001 |
ethyl octanoate | 64.78 ± 9.79 b | 86.76 ± 9.01 a | 105.61 ± 8.17 a | 64.75 ± 9.78 b | 91.98 ± 7.76 a | <0.001 |
ethyl decanoate | 18.65 ± 3.16 c | 21.91 ± 2.32 bc | 29.41 ± 4.44 a | 18.66 ± 2.31 c | 25.82 ± 2.54 ab | <0.001 |
diethyl succinate | 3.07 ± 0.59 b | 3.79 ± 0.82 b | 5.90 ± 0.85 a | 2.90 ± 0.74 b | 4.22 ± 0.80 b | <0.001 |
ethyl 9-decenoate | 2.17 ± 0.66 a | 2.43 ± 0.62 a | 2.93 ± 0.15 a | 2.02 ± 0.63 a | 2.86 ± 0.60 a | 0.139 |
citronellol | 1.04 ± 0.15 ab | 1.04 ± 0.20 ab | 1.22 ± 0.22 ab | 0.87 ± 0.14 b | 1.45 ± 0.35 a | 0.027 |
2-phenylethyl acetate | 14.79 ± 1.87 bc | 17.49 ± 2.53 b | 24.33 ± 1.79 a | 11.37 ± 1.11 c | 18.05 ± 1.30 b | <0.001 |
β-damascenone | 0.67 ± 0.08 bc | 0.62 ± 0.12 c | 1.21 ± 0.16 a | 0.47 ± 0.08 c | 0.90 ± 0.11 b | <0.001 |
geraniol | 0.71 ± 0.15 b | 0.79 ± 0.14 b | 1.35 ± 0.17 a | 0.63 ± 0.15 b | 1.10 ± 0.08 a | <0.001 |
hexanoic acid | 10.60 ± 1.84 cd | 14.51 ± 1.50 b | 22.58 ± 2.47 a | 9.82 ± 0.95 d | 13.90 ± 1.08 bc | <0.001 |
2-phenylethanol | 81.82 ± 12.06 bc | 96.02 ± 8.80 bc | 148.66 ± 14.21 a | 75.97 ± 9.93 c | 104.22 ± 7.57 b | <0.001 |
octanoic acid | 212.35 ± 30.19 cd | 246.22 ± 18.48 bc | 298.51 ± 19.52 a | 175.49 ± 13.55 d | 279.19 ± 26.53 ab | <0.001 |
2-methoxy-4-vinylphenol | 0.95 ± 0.20 bc | 1.08 ± 0.19 bc | 2.18 ± 0.12 a | 0.85 ± 0.23 c | 1.31 ± 0.15 b | <0.001 |
decanoic acid | 59.43 ± 9.14 bc | 64.60 ± 10.63 abc | 80.58 ± 4.41 a | 52.05 ± 7.37 c | 73.37 ± 5.77 ab | 0.001 |
Different letters within a row indicate significant pairwise differences between treatments according to Tukey’s HSD test (p < 0.05). Tukey groupings were based on individual compound-level analyses, whereas the statistical significance of the overall treatment effect was determined using BH-adjusted ANOVA p-values. Values are presented as mean ± standard deviation (n = 3). BH-adjusted p-values were calculated from one-way ANOVA p-values using the Benjamini–Hochberg false discovery rate procedure across all 33 compound-level tests reported for the 2022 season in Tables 2, 4, and 6.
The total abundance of volatile compounds differed markedly among treatments. The highest total concentration equivalent was recorded in treatment C (964.32 µg L-1 equivalents), followed by E (805.57 µg L-1 equivalents), B (722.82 µg L-1 equivalents), A (610.52 µg L-1 equivalents), and D (539.15 µg L-1 equivalents). Thus, similarly to the 2021 season, the combined mycorrhizal treatment C produced the most abundant wine volatile profile, whereas the fully fertilised control D showed the lowest total abundance.
Treatment C exhibited the highest mean concentrations of most compounds, including isoamyl acetate, isoamyl alcohol, ethyl hexanoate, hexyl acetate, 1-hexanol, ethyl octanoate, ethyl decanoate, diethyl succinate, 2-phenylethyl acetate, β-damascenone, hexanoic acid, 2-phenylethanol, octanoic acid, 2-methoxy-4-vinylphenol, and decanoic acid. Particularly pronounced treatment effects were observed for 1-hexanol, 2-phenylethanol, and octanoic acid. Treatment E also contained relatively high concentrations of ethyl octanoate, octanoic acid, and decanoic acid, contributing to its second-highest total volatile abundance.
Esters associated with fruity aroma characteristics, including isoamyl acetate, ethyl hexanoate, hexyl acetate, ethyl octanoate, ethyl decanoate, and 2-phenylethyl acetate, were generally present at higher concentrations in treatment C than in the fully fertilised control D. However, the Tukey grouping indicated that treatment C did not differ significantly from B or E for some individual esters.
After Benjamini–Hochberg correction, significant treatment effects were retained for 17 of the 18 compounds. Ethyl 9-decenoate was the only compound that did not differ significantly among treatments (BH-adjusted p = 0.139).
Principal component analysis revealed treatment-dependent differentiation of the volatile profiles in musts and wines from the 2021 season (Figure 3). For free volatile compounds in musts, PC1 and PC2 explained 49.07 % and 27.68 % of the total variance, respectively, accounting jointly for 76.75 %. Treatment C was clearly separated from the remaining treatments along PC1, whereas treatments B and D were differentiated mainly along PC2 and occupied opposite regions of the score plot. Treatments A and E were located closer to the centre of the multivariate space, although they formed distinguishable clusters.
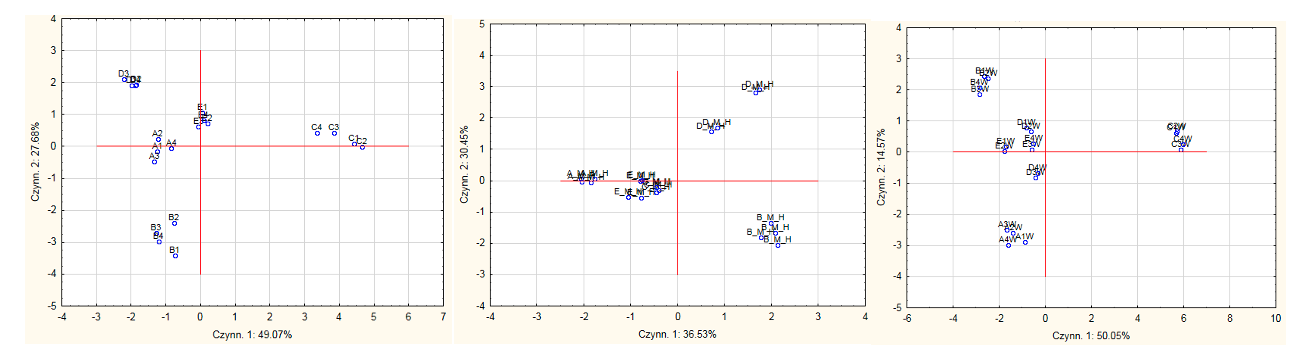
Figure 3. Principal component analysis score plots of free volatile compounds identified in grape musts (left), volatile aglycones released from glycosidically bound aroma precursors after enzymatic hydrolysis of must samples (centre), and volatile compounds identified in wines (right) in the 2021 season.
For volatile aglycones released from glycosidically bound aroma precursors, the first two principal components explained 64.62 % of the total variance, with 50.05 % attributed to PC1 and 14.57 % to PC2. Treatment C was strongly separated from all other treatments along PC1. Among the remaining treatments, B and A were differentiated mainly along PC2, while D and E occupied more central positions.
The PCA of wine volatile compounds explained 66.98 % of the total variance in the first two components, comprising 36.53 % for PC1 and 30.45 % for PC2. Treatments B and D were located on the positive side of PC1 but were clearly separated along PC2, with D showing positive and B negative PC2 scores. Treatment A was positioned on the negative side of PC1, whereas treatments C and E occupied relatively close positions near the centre-left region of the plot. Thus, the differentiation observed in wines was less dominated by a single treatment than that observed for the must fractions.
A clearer multivariate differentiation of treatments was observed in the 2022 season (Figure 4) and for free volatile compounds in musts; PC1 and PC2 explained 57.67 % and 25.12 % of the total variance, respectively, corresponding to a cumulative explained variance of 82.79 %. Treatment C was clearly separated from the other treatments, displaying strongly positive PC1 and negative PC2 scores. Treatment B was distinguished mainly by positive PC2 scores, whereas treatment D occupied the negative region of both components. Treatments A and E were located relatively close to one another on the negative side of PC1.
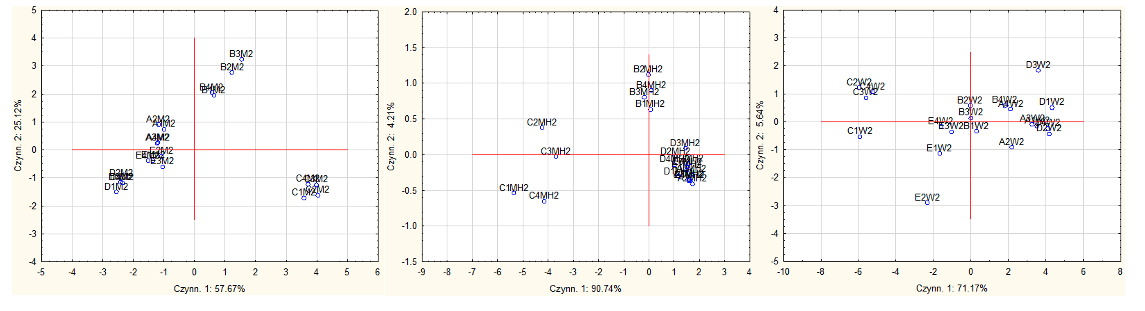
Figure 4. Principal component analysis score plots of free volatile compounds identified in grape musts (left), volatile aglycones released from glycosidically bound aroma precursors after enzymatic hydrolysis of must samples (centre), and volatile compounds identified in wines (right) in the 2022 season.
PCA of volatile aglycones released after enzymatic hydrolysis showed the strongest separation, with PC1 alone explaining 90.74 % of the variance and PC2 explaining a further 4.21 %, giving a cumulative value of 94.95 %. Treatment C was distinctly separated from all other treatments along PC1. Treatment B occupied an intermediate position and was further differentiated by positive PC2 scores, whereas treatments A, D, and E formed an overlapping cluster on the positive side of PC1. This pattern indicates that the combined inoculation treatment produced the most distinct profile of glycosidically bound aroma precursors.
For wine volatile compounds, PC1 and PC2 accounted for 71.17 % and 5.64 % of the total variance, respectively, jointly explaining 76.81 %. Treatment C was clearly separated on the negative side of PC1, while treatments A and D were located predominantly on its positive side and showed partial overlap. Treatment B occupied an intermediate position, whereas treatment E was positioned between C and the central cluster and showed greater within-treatment dispersion. The relatively small contribution of PC2 indicates that treatment differentiation in the 2022 wines was governed primarily by PC1.
Conclusion
The combined inoculation treatment containing ectomycorrhizal and arbuscular mycorrhizal preparations under reduced mineral fertilisation was consistently associated with the highest overall abundance of free volatile compounds and glycosidically bound aroma precursors in grape musts, as well as with an enhanced volatile profile in the resulting wines. This pattern was observed across both seasons and was supported by the PCA, which generally distinguished the combined treatment from the non-inoculated controls. In contrast, the fully fertilised control typically exhibited lower total abundances of aroma-related compounds, although the magnitude and direction of the response varied among individual compounds, sample types, and seasons.
These findings indicate that the combined inoculation treatment may modulate grape and wine aroma composition under reduced mineral fertilisation. However, the results should be interpreted as treatment-associated responses rather than direct evidence of a causal effect of root colonisation, because colonisation was not independently confirmed by microscopic or molecular methods. In addition, the volatile data were obtained using a semi-quantitative GC–MS approach, and complete instrumental maturity parameters were not available for all treatments and seasons. Further multi-season studies combining direct quantification of root colonisation, detailed berry-maturity measurements, and fully quantitative analysis of aroma compounds are required to confirm the reproducibility and biological basis of the observed effects.
References
- Arnold, C., Gillet, F., & Gobat, J. M. (1998). Situation de la vigne sauvage Vitis vinifera subsp. silvestris en Europe [Situation of the wild vine Vitis vinifera subsp. silvestris in Europe]. Vitis 37(4), 159–170. https://doi.org/10.5073/vitis.1998.37.159-170
- Bönisch, F., Frotscher, J., Stanitzek, S., Rühl, E., Wüst, M., & Bönisch, F. (2014). A UDP-glucosyltransferase from Vitis vinifera L. glycosylates the C13-norisoprenoid 3-oxo-α-ionol. Plant Physiology, 165(1), 23–36. https://doi.org/10.1104/pp.113.233940
- Cangahuala-Inocente, G. C., da Silva, M. F., Johnson, J. M., Manga, A., van der Heijden, M. G. A., & Bonfante, P. (2011). Arbuscular mycorrhizal symbiosis elicits proteome responses opposite of P-starvation in SO4 grapevine rootstock upon root colonisation with two Glomus species. Mycorrhiza, 21(6), 495–507. https://doi.org/10.1007/s00572-010-0352-0
- Caputi, L., Malnoy, M., Goremykin, V., Nikiforova, S., & Martens, S. (2011). A genome-wide phylogenetic reconstruction of family 1 UDP-glycosyltransferases revealed the expansion of the family during the adaptation of plants to life on land. Plant Physiology, 157(3), 1099–1110. https://doi.org/10.1104/pp.111.186544
- Dudareva, N., Negre, F., Nagegowda, D. A., & Orlova, I. (2006). Plant volatiles: Recent advances and future perspectives. Annual Review of Plant Biology, 57, 431–449. https://doi.org/10.1146/annurev.arplant.57.032905.105110
- Dziadas, M., & Jeleń, H. H. (2016). Comparison of enzymatic and acid hydrolysis of bound flavor compounds in model system and grapes. Food Chemistry, 190, 412–418. https://doi.org/10.1016/j.foodchem.2015.05.089
- Gilbert, J. A., Van der Lelie, D., & Zarraonaindia, I. (2014). Microbial terroir for wine grapes. Proceedings of the National Academy of Sciences, 111, 5–6. www.pnas.org/cgi/doi/10.1073/pnas.1320471110
- Gunata, Y. Z., Bayonove, C. L., Baumes, R. L., & Cordonnier, R. E. (1985). The aroma of grapes: Extraction and determination of free and glycosidically bound fractions of some grape aroma components. Journal of the Science of Food and Agriculture, 36(9), 857–864. https://doi.org/10.1002/jsfa.2740360912
- Hajdu, E., & Borbasne Sasköi, E. (2003). Selection of the table grape variety ‘Pannónia Kincse’.” Acta Horticulturae, 603 (88), 651–660, https://doi.org/10.17660/ActaHortic.2003.603.88
- Jackson, R. S. (2020). Wine Science: Principles and Applications, Fifth Edition. Elsevier. eBook ISBN: 9780128165379
- Karoglan, M., Radić, T., Anić, M., Andabaka, Ž., Stupić, D., Tomaz, I., Mesić, J., Karažija, T., Petek, M., Lazarević, B.; Poljak, M., & Osrečak, M. (2021). Mycorrhizal Fungi Enhance Yield and Berry Chemical Composition of in Field Grown “Cabernet Sauvignon” Grapevines (V. vinifera L.). Agriculture, 11, 615. https://doi.org/10.3390/agriculture11070615
- Landi, L., Foglia, R., Murolo, S. & Romanazzi, G. (2021). The Mycorrizal Status in Vineyards Affected by Esca. Journal of Fungi, 7, 869. https://doi.org/10.3390/jof7100869
- Likar M., Hančević, K., Radić, T., & Regvar, M. (2013). Distribution and diversity of arbuscular mycorrhizal fungi in grapevines from production vineyards along the eastern Adriatic coast. Mycorrhiza 23, 209–219. DOI 10.1007/s00572-012-0463-x
- Martín, F. F., Molina, J. J., Nicolás Nicolás, E., Alarcón, J. J., Kirchmair, M., García, F. J., Bernabe Garcia, A. J., & Bernal, C. (2017). Application of Arbuscular Mycorrhizae Glomus iranicum var. tenuihypharum var. nova in Intensive Agriculture: A Study Case. Journal of Agricultural Science and Technology B, 7, 221–247. doi: 10.17265/2161-6264/2017.04.001
- Massa, N., Bona, E., Novello, G., Todeschini, V., Boatti, L., Mignone, F., Gamalero, E., Lingua, G., Berta, G., & Cesaro, P. (2020). AMF communities associated to Vitis vinifera in an Italian vineyard subjected to integrated pest management at two different phenological stages. Scientific Reports, 10, 9197. https://doi.org/10.1038/s41598-020-66067-w
- Mateo, J. J., & Jiménez, M. (2000). Monoterpenes in grape juice and wines. Journal of Chromatography A, 881(1–2), 557–567. https://doi.org/10.1016/S0021-9673(00)00310-5
- Nicolas, E., Maestre-Valero, J. F., Alarcon, J. J., Pedrero, F., Vicente-Sanchez, J., Bernabe, A., Gomez-Montiel, J., Hernandez, J. A., & Fernandez, F. (2015). Effectiveness and persistence of arbuscular mycorrhizal fungi on the physiology, nutrient uptake and yield of Crimson seedless grapevine. The Journal of Agricultural Sciences, 153, 1084–1096. DOI: https://doi.org/10.1017/S002185961400080X
- Nogales, A., Campos, J. A., & Barea, J. M. (2009). Differential growth of mycorrhizal field-inoculated grapevine rootstocks in replant soils. Spanish Journal of Agricultural Research, 8(S1), 104–110. https://doi.org/10.5424/sjar/201008S1-1223
- Ocete, R., Armendariz, I., Cantos, M., Alvarez, D., & Azcon, R. (2015). Ecological characterization of wild grapevine habitats focused on arbuscular mycorrhizal symbiosis. Vitis 54, 207–211. https://doi.org/10.5073/vitis.2015.54.special-issue.207-211
- Radić, T., Hančević, K., Likar, M., Regvar, M., & Zdunić, G. (2018). High incidence of arbuscular mycorrhizal fungi in rare and endangered wild grapevine. Plant Biosystems 152(5), 1075–1078. https://doi.org/10.1080/11263504.2017.1415994
- Radić, T., Likar, M., Hančević, K., Regvar, M., Čarija, M., & Zdunić, G. (2021). Root-associated community composition and co-occurrence patterns of fungi in wild grapevine. Fungal Ecology, 50, 1–11. https://doi.org/10.1016/j.funeco.2020.101034
- Salomon, M. V., Bottini, R., Apolinario de Souza Filho, G., Cohen, A. C., Moreno, D., Gil, M., & Piccoli, P. (2014). Bacteria isolated from roots and rhizosphere of Vitis vinifera retard water losses, induce abscisic acid accumulation and synthesis of defense-related terpenes in in vitro cultured grapevine. Physiologia Plantarum, 151, 359–374. https://doi.org/10.1111/ppl.12117
- Schreiner, R. P. (2003). Mycorrhizal colonization of grapevine rootstocks under field conditions. American Journal of Enology and Viticulture, 54, 143–149.
- Schreiner, R. P. (2007). Effects of native and nonnative arbuscular mycorrhizal fungi on growth and nutrient uptake of ‘Pinot noir’ (Vitis vinifera L.) in two soils. Mycorrhiza, 17(5), 331–341. https://doi.org/10.1007/s00572-007-0128-3
- Schreiner, R. P. (2020). Depth structures the community of arbuscular mycorrhizal fungi amplified from grapevine (Vitis vinifera L.) roots. Mycorrhiza, 30: 149 – 160. https://doi.org/10.1007/s00572-020-00930-6
- Schwab, W., Davidovich-Rikanati, R., & Lewinsohn, E. (2008). Biosynthesis of plant-derived flavor compounds. Nature Chemical Biology, 4(2), 113–118. https://doi.org/10.1038/nchembio.2007.3
- Sefton, M. A., Francis, I. L., & Williams, P. J. (1993). The volatile composition of Chardonnay juices: A study by flavour precursor analysis. Journal of Agricultural and Food Chemistry, 41(7), 1090–1094. https://doi.org/10.1021/jf00031a028
- Svitlica, B., Karoglan, M., Jagatić Korenika, A.-M., Ćosić, J., Pichler A., Ivić, I., & Mesić. J. (2025). The Influence of Mycorrhizae Inoculation on the Grape Ripening and the Aromatic Profile of the Graševina Variety’s (Vitis vinifera L.) Must. Poljoprivreda (Osijek), 31, 25–32. https://doi.org/10.18047/poljo.31.1.3
- Torres, N., Antolín, M. C., & Goicoechea, N. (2016). Berry quality and antioxidant properties in Vitis vinifera L. cv. Tempranillo inoculated with arbuscular mycorrhizal fungi and subjected to deficit irrigation. Crop & Pasture Science, 67(8), 875–887. https://doi.org/10.1071/CP16038
- Torres, N., Antolín, M. C., & Goicoechea, N. (2018). Influence of irrigation strategy and mycorrhizal inoculation on fruit quality in different clones of Tempranillo grown under field conditions. Agricultural Water Management, 196, 34–44. https://doi.org/10.1016/j.agwat.2017.12.004
- Trouvelot, S., Bonneau, L., Redecker, D., van Tuinen, D., Adrian, M., & Wipf, D. (2015). Arbuscular mycorrhiza symbiosis in viticulture: A review. Agronomy for Sustainable Development, 35, 1449–1467. https://doi.org/10.1007/s13593-015-0329-7
- Velásquez, A., Vega-Celedón, P., Fiaschi, G., Agnolucci, M., Avio, L., Giovannetti, M., D’Onofrio, C., & Seeger, M. (2020). Responses of Vitis vinifera cv. Cabernet Sauvignon roots to the arbuscular mycorrhizal fungus Funneliformis mosseae and the plant growth-promoting rhizobacterium Ensifer meliloti include changes in volatile organic compounds. Mycorrhiza, 30, 161–170. https://doi.org/10.1007/s00572-020-00933-3
- Viret, O., & Gindro, K. (2025). Fungi and Grapevine Mycobiota. In: Science of Fungi in Grapevine. Springer. https://doi.org/10.1007/978-3-031-68663-4
 Views: 210
 XML: 24