

ENOLOGY / Original research article
Abstract
Sensory evaluation studies of light-struck flavour reported in the literature mostly concentrate on the onset of typical off-aromas related to sulfur-containing products However, some recent chromatographic studies have also confirmed the change in varietal aroma compounds during light exposure before attaining the sensory threshold for wine faults. In this study, we have looked for aroma changes by sensory evaluation prior to the onset of typical light-struck notes in sparkling wines of different composition, technology and duration of lees contact. Evaluations were done in two different settings: i) completely randomised blind tasting, and ii) a tasting of a series of samples of known identity without the knowledge of the randomised order of light exposure durations. Thus, we aimed to simulate the real-life experience of consumers who do not have information about the actual shelf life of sparkling wines they buy. The main results are that, after moderate light doses – prior to the onset of light-struck off-flavours – tasters cannot distinguish significant differences depending on the length of exposure. In some cases, they rated moderately illuminated samples even higher than the control, reporting pleasant mellow, honey-like notes. HS–SPME–GC–MS studies supported a non-monotonic change in the aroma profile, similarly to a few recent findings reported in the literature. We also found marked differences in these temporal evolution patterns depending on the composition, technology, and vintage of the sparkling wine samples. We conclude that a proper consumer protection protocol would entail the monitoring of the light exposure of the bottles and consequently not selling wines when the critical light dose has been absorbed, which ultimately triggers a perceptible light-struck flavour.
Introduction
The quality of bottled sparkling wines during storage has become an essential focus for the wine industry, given the increasing demand for premium-quality beverages (del Rey & Loose, 2023; Mueller Loose & del Rey, 2024). One of the significant challenges is light exposure, which can result in undesirable sensory changes called “light-struck flavour” (LSF). This wine fault arises, mostly in white wines, from photochemical reactions involving riboflavin (vitamin B2) and sulfur-containing amino acids, as well as ethanol, leading to the formation of various sulfur-containing compounds, which produce off-aromas, e.g., onion-, cabbage-, rotten egg- and garlic-like notes (Mattivi et al., 2000; Arapitsas et al., 2020).
This can significantly impact the sensory and chemical properties of still and sparkling white wines, leading to undesirable changes (Maujean & Seguin, 1983; Grant-Preece et al., 2017). Packaging plays a crucial role in mitigating light-induced damage, with bottle type being a key factor. Flint glass bottles, while aesthetically pleasing, allow high light transmission, thus enabling intense photochemical degradation. Green bottles transmit somewhat less light, but they cannot provide important protection either. In contrast, amber bottles provide much greater protection, significantly reducing the risk of light-struck faults (Fracassetti et al., 2017; Dubinina et al., 2023; Laposa et al., 2023).
The first systematic studies of the light-struck flavour in wine were conducted on Champagne sparkling wines (Haye et al., 1977; Maujean et al., 1978), and a detailed sensory study was also reported soon thereafter (Noble & Dozon, 1989). In this latter paper, not only the onset of the LSF was sensorially tested, but changes in the aroma profile by a detailed descriptive analysis were also followed as a function of light exposure. While citrus aroma notes monotonically decreased with increasing light dose in the sparkling wine, honey notes increased after moderate light dose only somewhat decreasing after the highest dose applied.
Chromatographic investigations have also supported the sensory impact of light exposure, highlighting the role of riboflavin in photocatalysed reactions that degrade aliphatic esters and other aroma compounds. This degradation has been studied in different white wines, with consistent findings regarding the protective effects of packaging and storage improvements (Acquaviva et al., 2014). Similar chromatographic experiments have also been conducted on red wines (D’Auria et al., 2009). These two studies report interesting findings: the concentration of several aroma compounds evolved non-monotonically during continued irradiation; the concentration of some having minima, some having maxima, and some having a mixed behaviour.
The influence of light on the stability of volatile aromatic compounds, including linalool and ethyl esters, has also been studied extensively in sparkling wines, with findings underscoring the role of colour and material of bottles in preserving champagne's sensory integrity (D’Auria et al., 2003). Oxidative degradation processes in the presence of dissolved oxygen can also be triggered by light exposure, leading to the formation of glyoxylic acid and sulfur-based compounds that accelerate the breakdown of aromatic esters and volatile aromatic compounds, compromising the sensory integrity of sparkling wines, as summarised in a review article (Fracassetti et al., 2021). This review describes two types of LSF formation and also contains several recommendations concerning effective measures for preserving the sensory quality of wine.
The studies cited above typically concentrate on the development and detection – either by sensory trial or by chemical analysis separately or combined – of wine faults in sparkling wine, with only a few of them tracing varietal aroma changes as well. In the present study we aimed to simulate how consumers evaluate them when they buy a bottle of sparkling wine off the shelf after some irradiation by the damaging ambient light of the retail store, not knowing the state of eventual light-strike. For this reason, experiments were made with moderate light doses that do not completely spoil the wine, with standard wine tasting protocols used during sensory analyses and the order of samples randomised during tasting.
Materials and methods
1. Sparkling wines studied
Samples used in this study were produced by the Törley Sparkling Wine Cellar, Budapest, Hungary; base wines from Etyek-Buda Wine Region, Hungary (Törley Sparkling Wine Cellar, 2026), including sparkling wines of one-year maturation, produced using the Charmat method, in two different colour bottles; and three different vintage sparkling wines produced using the traditional “Champenoise” method. Their analytical parameters are the following.
The Gála Sec sparkling wines were produced from a blend of Grüner Veltliner (60 %), Királyleányka (25 %), and Olaszrizling (Hungarian name for Welschriesling; 15 %) grapes. The grapes were harvested in mid-September with acidity levels ranging between 7.0–7.5 g/L and sugar content measured at approximately 20–21 °Brix. The alcoholic fermentation of the base wine was carried out in stainless steel tanks at a controlled temperature of 12–14 °C, using selected yeast strains. Ageing was relatively short, lasting only 6–12 months, with minimal lees contact, which helped reduce the accumulation of riboflavin and other light-sensitive compounds. The secondary fermentation conducted using the Charmat method also took place in tanks, where the pressure of the wines reached 6.0–6.5 bar. Following filtration and stabilisation, the sparkling wines were bottled. Two types of bottles were used in our experiments: flint and green glass, offering different levels of protection against light exposure.
The François Brut Nature sparkling wines were produced from a blend of Chardonnay and Pinot noir grapes. Chardonnay was used in greater proportions (65–85 %), while Pinot noir contributed in a smaller proportion (15–35 %) to the blend. The grapes were harvested in late August, with an acidity of 8.0 g/L and a sugar content of approximately 20–21 °Brix. The primary fermentation occurred in stainless steel tanks at 14–16 °C, followed by secondary fermentation and ageing in bottles. For the 2019 vintage, lees ageing lasted for approximately 45 months, while the 2020 and 2021 vintages were aged on lees for 33 and 21 months, respectively. The prolonged contact with lees during bottle ageing could contribute to the development of complex aromas and flavours but supposedly also increased the concentration of riboflavin, making these wines more sensitive to light-induced changes with respect to the Gála sec wine. Disgorgement was performed to remove the lees, after which only sulfites were added for microbiological and oxidative stabilisation of the wine. These wines were bottled in thick-walled dark green glass bottles to provide enhanced protection against UV and bluish light. The normal technological procedure is to release them to the market two months after disgorgement.
The compositional differences between the samples highlight the impact of production methods and ageing conditions on their sensitivity to light exposure. Gála Sec (Charmat method) sparkling wines had an alcohol content of 11.8 % vol., sugar levels of 20 g/L, acidity of 6.0 g/L, and a pH of 3.15. The François Brut Nature (traditional method) sparkling wines differed slightly by vintage: the 2019 vintage had an alcohol content of 11.9 % vol., sugar-free, with an acidity of 7.6 g/L and a pH of 3.2; the 2020 vintage contained 12.4 % vol. alcohol, no sugar, acidity of 7.2 g/L, and a pH of 3.3; while the 2021 vintage had 12.5 % vol. alcohol, no sugar, acidity of 6.5 g/L, and a pH of 3.3. Traditional sparkling wines were matured on lees until disgorgement and bottled for the illumination experiments.
To identify the samples, the codes XY12.34(5) are used, where ‘XY’ identifies the technology and bottle type of the sparkling wine, ‘12’ identifies the vintage year and ‘34(5)’ identifies the time of illumination in hours. A table with a complete list summarises the properties of the samples according to this coding system in Table S1.
2. Pre-experiments
Preliminary experiments were designed based on modelling wine damage described in a previous publication (Laposa et al., 2023). Pre-experiment tasting following illuminations with different light doses calculated this way was conducted to determine optimal illumination times for studying light-induced sensory changes before attaining pronounced degradation.
3. Illumination times
The sparkling wines were subjected to different illumination times determined as a result of the pre-experiment. Compact fluorescent lamps (CFLs) of 20 W power were used, and necessary light doses were calculated to achieve the desired degree of light damage in terms of illumination times as follows:
- Sparkling wine in clear (flint) bottles: 2, 5, 10, and 20 hours.
- Sparkling wine in green bottles: 3, 10, 20, and 30 hours.
- Traditional sparkling wines in thick-walled dark green bottles: 2, 10, and 20 days.
The exposure was conducted in a standardised laboratory setting using the above mentioned CFL light sources with identical power and spectrum at 20 cm distance from the shoulders of the bottles arranged in a circle. The direction of illumination was from above at 45° with respect to the vertical axis of the bottles, imitating usual shelf illumination in stores. Following the exposure, the bottles were covered with aluminium foil to avoid extra exposure to light before and during the sensory tests and the chromatographic analysis.
4. Tasting protocols
4.1. Samples
A total of 22 samples were evaluated, representing two main categories of sparkling wines:
- Flint and green bottle Charmat sparkling wines; both bottle types included a non-illuminated control sample and four samples with different illumination times, resulting in a total of five samples per bottle type.
- Dark green thick-walled bottle “François Brut Nature” sparkling wines; each of the three vintages included a control sample and three samples with different illumination times, resulting in a total of four samples per vintage.
Code | Brand | Method | Bottle | Vintage | Varietal composition | Lees ageing (months) | Alcohol v/v % | Sugar g/L | Total acid g/L | pH | Illumination (hours) |
CF23 | Gála Sec | Charmat | Clear (flint) 3.0 mm thick | 2023 | Grüner Veltliner 60 % Királyleányka 25 % Olaszrizling 15 % | 10 | 11.8 | 20 | 6.0 | 3.15 | 0, 2, 5, 10, 20 |
CG23 | Gála Sec | Charmat | Green 2.7 mm thick | 2023 | Grüner Veltliner 60 % Királyleányka 25 % Olaszrizling 15 % | 10 | 11.8 | 20 | 6.0 | 3.15 | 0, 3, 10, 20, 30 |
FB19 | François Brut Nature | Traditional | Thick dark green 3.75 mm thick | 2019 | Chardonnay 65–85 % Pinot noir 15–35 % | 45 | 11.9 | 0 | 7.6 | 3.2 | 0, 48, 240, 480 |
FB20 | François Brut Nature | Traditional | Thick dark green 3.75 mm thick | 2020 | Chardonnay 65–85 % Pinot noir 15–35 % | 33 | 12.4 | 0 | 7.2 | 3.3 | 0, 48, 240, 480 |
FB21 | François Brut Nature | Traditional | Thick dark green 3.75 mm thick | 2021 | Chardonnay 65–85 % Pinot noir 15–35 % | 21 | 12.5 | 0 | 6.5 | 3.3 | 0, 48, 240, 480 |
4.2. Evaluation methods
The objective of the tasting was to understand how tasters evaluate different types of sparkling wines and their aromas, as well as which sensory attributes they focus on in each sample. The evaluation was not directly aimed at tracking the deterioration of the wines, but rather at identifying which characteristics dominate in each sample. The tasting was conducted in a dedicated tasting room at Törley Pezsgőpincészet Kft., 1222 Budapest, Háros u. 2–6, Hungary, in two distinct sessions, using internationally recognised protocols to assess the sensory attributes of the sparkling wines:
- 100-point evaluation system: All 22 samples were tasted in a completely randomised order by 13 panellists using the OIV-approved sensory evaluation sheet for sparkling wines (OIV, 2026). This protocol focuses on key sensory attributes, including aroma, taste, and overall quality, providing a comprehensive assessment of each sample using numerical scores.
- 20-point evaluation system (American Wine Society, 2026): In this tasting session, the 22 samples were evaluated by 10 experienced tasters out of the above panellists, specifically: wine writers, winemakers, and Törley staff members. Scores could include half-points, and the evaluation criteria are shown in Table 2.
To reduce fatigue, there was a one-hour lunch break between the two sessions. Due to organisation problems – tasters were selected based on their availability and motivation – neither of the two tasting sessions could be independently repeated with the same tasters.
The 20-point tasting protocol’s descriptive evaluation section also allowed panellists to enter different aromas into categories (primary, secondary, and tertiary aromas, as well as faults) based on provided examples, determining the intensity of the aromas and faults (for both smell and taste). For this purpose, the official French Champagne tasting notes sheet was used (Comité Champagne, 2026), translated into Hungarian.
Attribute | Scale | Description |
Visual aspect | 0–2 | colour and clarity |
Nose | 0–4 | fruity, floral, toasted notes |
Taste and harmony | 0–6 | Intensity, balance of acids/sugars, flavour length |
Effervescence | 0–4 | fineness, persistence, quality |
Harmony and overall impression (including persistence) | 0–4 | |
Descriptive evaluation | n. a. | specific aromas, potential off-flavour |
4.3. Panellists
The sensory evaluation was carried out by a diverse panel of tasters, grouped into four categories to ensure a balanced and comprehensive analysis:
- Wine experts (4 participants): all four completed the 100-point evaluation. Two of them also completed the 20-point evaluation.
- Törley Sparkling Wine Cellar staff (3 participants): all three completed both the 100-point and the 20-point evaluations.
- Winemakers (5 participants): all five completed both the 100-point and the 20-point evaluations.
- Consumer (1 participant): This participant completed only the 100-point evaluation.
The 13 panellists (10 males and 3 females, ranging in age from 30 to 74 years) were selected based on their availability and motivation. Except for the consumer, all of them were well-trained tasters (the consumer received adequate training prior to the tasting sessions).
5. Chromatographic analysis
For the chromatographic studies of the samples, the Headspace Solid Phase Micro-Extraction–Gas Chromatography–Mass Spectrometry (HS-SPME-GC-MS) method was adapted. (See e.g., Câmara et al., 2006) After opening a bottle, 100 mL of the sparkling wine was filled into a beaker and stirred for 5 minutes, until the CO2 pressure diminished to the ambient pressure, enabling the wine to be pipetted. An aliquot of 5 mL was then introduced into a headspace sampling vial which was then sealed with a septum. An SPME fibre assembly coated with 75 µm Carboxen/Polydimethylsiloxane (CAR/PDMS) was inserted and kept over the sample for 10 minutes. The fibre was then introduced into the injection port of a Shimadzu GCMS-QP2010 gas chromatograph–mass spectrometer instrument, desorbed for 1 min at 220 °C, when the GC-MS measurement started (1 min at 220 °C also guaranteed the complete desorption of the fibre, becoming ready for the next sampling). For reproducibility reasons, the same SPME fibre assembly was used for all the samples. We performed three independent measurements for each sample.
A Zebron ZB-Wax capillary column (30 m × 0.25 mm × 0.25 µm film thickness) separated the desorbed components with helium carrier gas at a flow rate of 48.1 cm/s and a split ratio of 50:1. The initial column oven temperature was 40 °C for 5 minutes, increased to 200 °C with a temperature increase rate of 10 °C/min, then kept at 200 °C. The GC/MS interface and the ion source were also kept at 200 °C. The energy of the ionising electrons was 70 eV, the acceleration voltage 4 kV and the voltage of the detector 1.1 kV. The spectrum was scanned for a mass/charge ratio between 25 and 500.
As we were interested in the trend of aroma component contents with increasing light doses, we did not use standards to determine absolute concentrations. Relative concentrations were measured within 15 % uncertainty.
6. Statistical analysis
The scores of both the 100-point and 20-point protocol sheets were evaluated using traditional methods by calculating summary statistics like averages, standard deviations and 90 % confidence intervals, the latter based on Student’s t-distribution. These statistics were calculated for all the panellists, as well as for each of the first three groups (the fourth “group” was only one consumer), and for all the sparkling wine samples as well.
As the scales of different types of scores for different panellists did not give results whose correlations could be interpreted in a sensible way, ranking statistics were also calculated to compare panellists and samples. The most promising method for comparison seemed to be the Sum of Ranking Differences (SRD) algorithm. SRD and its applications in tasting are described in detail in the literature (Kollár-Hunek et al., 2008; Héberger, 2010; Héberger & Kollár-Hunek, 2011; Guld et al., 2020). SRD is based on ranking two vector variables with elements of xik and xjk resulting in ranks l(xik) and m(xjk), where l is the rank of the element xik within the vector xi, and m is the rank of the element xjk within the vector xj. The value of SRD is then calculated with the following equation:
(Equation 1)
In the formula, m(xjk) is the rank of the benchmark (reference) vector xj and the summation is done for all elements k of the two vectors. Obviously, SRDij is zero if the two vectors xi and xj are identical, and it has an increasing value with increasing ranking differences. For easier comparison, we can also rescale the SRDij values to fall between 0 and 1 (or between 0 and 100 %) by dividing by the maximal SRDij.
Thus, we can have a measure of similarity between the vectors by comparing them to a reference: the closer the value to zero, the more similar they are to the reference; and vice versa: the closer the value to 1 (or 100 %), the greater the differences between them. There are also close similarities between vectors whose SRD values are closely clustered, and differences between clusters if they gather at a greater distance from each other.
Results and discussion
1. Summary of the sensory evaluations
Numerical results containing average scores of all the panellists are shown in Tables 3 and 4 for the 100-point and 20-point protocols, respectively. Detailed results obtained according to the protocols are given in the Supplementary materials S2 and S3.
Code | Technology | Vintage year | Illumination (hours) | Average score1 | Uncertainty2 |
FB19.00 | traditional | 2019 | 0 | 70.2 | 4.24 |
FB19.48 | traditional | 2019 | 48 | 70.7 | 4.08 |
FB19.240 | traditional | 2019 | 240 | 72.5 | 5.16 |
FB19.480 | traditional | 2019 | 480 | 72.4 | 2.76 |
FB20.00 | traditional | 2020 | 0 | 71.6 | 3.82 |
FB20.48 | traditional | 2020 | 48 | 71.6 | 3.33 |
FB20.240 | traditional | 2020 | 240 | 70.8 | 2.89 |
FB20.480 | traditional | 2020 | 480 | 71.6 | 5.05 |
FB21.00 | traditional | 2021 | 0 | 76.4 | 3.23 |
FB21.48 | traditional | 2021 | 48 | 77.5 | 3.21 |
FB21.240 | traditional | 2021 | 240 | 74.5 | 3.97 |
FB21.480 | traditional | 2021 | 480 | 74.5 | 3.62 |
CG23.00 | Charmat | 2023 | 0 | 74.8 | 4.29 |
CG23.03 | Charmat | 2023 | 3 | 75.8 | 4.11 |
CG23.10 | Charmat | 2023 | 10 | 76.2 | 4.83 |
CG23.20 | Charmat | 2023 | 20 | 77.2 | 3.60 |
CG23.30 | Charmat | 2023 | 30 | 75.7 | 3.96 |
CF23.00 | Charmat | 2023 | 0 | 77.5 | 4.11 |
CF23.02 | Charmat | 2023 | 2 | 76.1 | 3.11 |
CF23.05 | Charmat | 2023 | 5 | 79.4 | 3.70 |
CF23.10 | Charmat | 2023 | 10 | 78.5 | 3.03 |
CF23.20 | Charmat | 2023 | 20 | 75.7 | 2.82 |
The first two letters in the code are the following: FB: François Brut Nature; CG: Charmat method green bottles; CF: Charmat method flint bottles. The following two-digit number refers to the vintage year. Numbers following the dot refer to the hours of illumination.
1 Average of the scores of 13 tasters. 2 Half-width of the 90 % confidence interval.
Code | Technology | Vintage year | Illumination (hours) | Average score1 | Uncertainty2 |
FB19.00 | traditional | 2019 | 0 | 14.1 | 1.44 |
FB19.48 | traditional | 2019 | 48 | 14.8 | 1.22 |
FB19.240 | traditional | 2019 | 240 | 15.5 | 1.10 |
FB19.480 | traditional | 2019 | 480 | 14.2 | 1.23 |
FB20.00 | traditional | 2020 | 0 | 15.7 | 1.54 |
FB20.48 | traditional | 2020 | 48 | 15.3 | 0.91 |
FB20.240 | traditional | 2020 | 240 | 15.0 | 1.60 |
FB20.480 | traditional | 2020 | 480 | 15.0 | 1.74 |
FB21.00 | traditional | 2021 | 0 | 15.5 | 1.34 |
FB21.48 | traditional | 2021 | 48 | 15.1 | 1.25 |
FB21.240 | traditional | 2021 | 240 | 14.7 | 1.30 |
FB21.480 | traditional | 2021 | 480 | 15.4 | 1.09 |
CG23.00 | Charmat | 2023 | 0 | 14.7 | 1.33 |
CG23.03 | Charmat | 2023 | 3 | 13.7 | 1.23 |
CG23.10 | Charmat | 2023 | 10 | 15.1 | 1.18 |
CG23.20 | Charmat | 2023 | 20 | 13.8 | 1.66 |
CG23.30 | Charmat | 2023 | 30 | 13.9 | 1.41 |
CF23.00 | Charmat | 2023 | 0 | 14.3 | 1.36 |
CF23.02 | Charmat | 2023 | 2 | 15.0 | 1.23 |
CF23.05 | Charmat | 2023 | 5 | 14.2 | 1.38 |
CF23.10 | Charmat | 2023 | 10 | 15.0 | 0.73 |
CF23.20 | Charmat | 2023 | 20 | 13.2 | 1.48 |
For the explanation of the code, see Tables 1 and 3.
1 Average of the scores of 10 tasters. 2 Half-width of the 90 % confidence interval.
As tasters were not informed about the detailed objective of the wine faults to look for, it turned out that changes induced by light exposure cannot be unequivocally identified based on sensory scores. However, the descriptive evaluation of flavour characteristics exhibits clear trends that align with previous results and the expected effects of light-induced processes. The tasting scores also indicated a trend – albeit not statistically significant – supporting that prolonged light exposure leads to sensory degradation in sparkling wines. This effect can be primarily attributed to the accumulation of sulfur-containing compounds, which are responsible for the development of the “light-struck” flavour. It was particularly evident in tank-fermented sparkling wines stored in flint bottles, where pleasant honey-like aromas emerged after brief exposure but were later replaced by oxidative and sulfurous notes over extended illumination.
2. Exploratory statistics
The exploratory statistical analysis aimed to identify significant patterns in the tasting data; however, practically no statistically significant differences in the scores were observed. While certain trends were noticeable in sensory evaluations, the variability in panellists’ ratings suggests that perception of the effects of moderate light doses on wine was subtle and difficult to detect. Although statistical significance was limited, clear trends emerge when analysing homogeneous subsets, indicating that low-to-moderate illumination can enhance certain desirable notes before oxidative decline.
The 20-point tasting scores showed that sparkling wines were rated somewhat more favourably due to their honey-like and slightly sweet aromatic profiles developed after low light doses, with respect to the control samples. However, as light exposure increased, oxidative and sulfurous attributes became perceptible, resulting in somewhat declining ratings. An exception to this trend was observed in the 2020 vintage, where scores continuously decreased, indicating that prolonged illumination-induced chemical alterations in this sparkling wine’s composition monotonically diminished its original highly desirable characteristics.
Tasting results of the 2019 vintage showed that higher light doses initially contributed to favourable aroma attributes; however, after 20 days of illumination, oxidation-related notes became more prominent. The panellist most familiar with the preparation of the samples – one of the authors, Z. L. – rated the 2019 vintage sample exposed to light for 2 days the highest but assigned lower scores to samples with longer exposure times. According to the other tasters, samples subjected to different illumination durations received similar scores, but as exposure time increased, oxidation-related notes became more pronounced, in some cases even leading to certain score reductions.
For the 2020 vintage, a gradual but also nonsignificant decline in scores was observed with increasing light exposure. This may be attributed to the control sample receiving the highest score, indicating that the panellists were more sensitive to changes compared to the control. While the average scores were somewhat higher, greater variability was observed for this vintage.
The 2021 vintage exhibited minimal differences between the low and high light-dose sample scores. Descriptive evaluations, however, indicated that after 20 days of illumination, undesirable notes emerged, although this was not always reflected in the numerical scores. Winemakers rated the two-day illuminated sample the highest but subsequently assigned lower scores, reinforcing the trend that floral and honey-like attributes were initially developed, while off-flavour notes became more noticeable after 10 or more days.
For tank-fermented sparkling wines stored in flint bottles, evaluations showed considerable variability, with the lowest scores observed after 20 hours of illumination. A notable decline in scores was recorded between samples illuminated for 10 and 20 hours. Oxidation-related notes appeared even at shorter illumination times. Green-bottled tank-fermented sparkling wines also exhibited high score variability, but scores declined between 20 and 30 hours of illumination, albeit non-significantly. Oxidation-related notes developed at lower light doses in these samples, but variations in panellists’ sensitivity resulted in important score dispersion (up to 13 % relative standard deviation in the 100-point session and 20 % in the 20-point session).
The 100-point tasting results exhibited similar patterns as the 20-point ones: sparkling wines initially received more favourable evaluations, but ratings mostly declined as light exposure intensified, though the differences were not statistically significant either. The completely randomised sample order may have introduced additional complexity, as panellists may have been influenced by variations in residual sugar content and vintage differences in samples following each other, potentially making the evaluation process more challenging. Thus, this tasting order led to an unintentional bias, causing all subsequent samples to be rated largely in relation to the previous ones. This bias was inevitable for technical reasons (limited tasting session time). However, the 100-point protocol was specifically designed to obtain results under conditions where panellists had no prior knowledge of the samples, ensuring that their assessments relied solely on sensory perception without any additional reference points. Though the results showed some differences between samples, these distinctions were less pronounced during this completely blind tasting session.
3. Descriptive evaluation
The descriptive evaluation was conducted by ten panellists taking part in the 20-point evaluation session, with descriptions from nine participants being fit for use, as one taster provided practically identical information for all samples and was therefore disqualified. In addition, the data from another taster were incomplete; thus, we have only eight complete descriptions of flavour notes to evaluate. Among these eight panellists, only four or five observed distinct changes. These descriptive evaluations differ from the scoring system and show some marked differences between certain samples. Descriptions have been quantified by allocating numbers indicating how many panellists mentioned primary, secondary, or tertiary aromas, or eventual faults. These quantified data are shown in diagrams in Figure 1.
Sample identification is shown in the upper right corner of the diagrams. The vertical axis shows the number of panellists selecting the attributes shown below the bars. Short categories of wine off-notes are the following: chemical (metallic, bitter, medicinal); stale (rancid, rubber, soaked wool); sulfurous (onion, cabbage, rotten egg, garlic). The colour code of the bars indicates the time of light exposure. 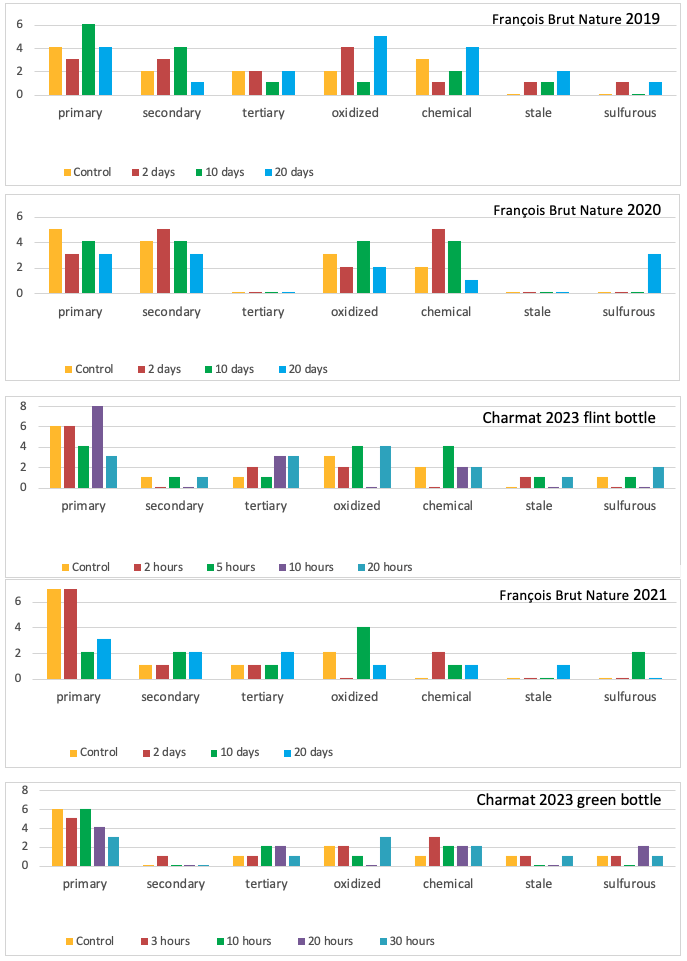
Figure 1. Results of the descriptive evaluation for the three traditional (brut nature) sparkling wines of different vintages and the 2023 vintage Charmat sparkling wines in different colour bottles.
Trends noticed between different samples can be summarised as follows. In traditional sparkling wines, primary aromas such as citrus fruits and tropical fruits, and secondary aromas such as baked goods and dairy derivatives, predominated. The persistence or loss of the primary aromas after different illumination times likely reflects the balance between ester hydrolysis and oxidative reactions; wines with higher initial antioxidant capacity usually maintain fruitiness. Signs of oxidative notes were already perceptible at low light exposure levels, even in the control samples, which could partly stem from the oxidation level of the base wine. The bitter and metallic taste may be related to the presence of sulfur-containing compounds, the concentration of which increases under prolonged light exposure. According to the descriptive evaluation, tasters often recognised differences between the samples, indicating that, with increasing light dose, these faults became gradually more prominent.
In traditional sparkling wines, tasters did not notice significant amounts of secondary aromas, likely due to the technological process. Therefore, tertiary aromas were more indicative of light-induced processes and appeared in the form of metallic and bitter notes in these sparkling wines. In traditional sparkling wines with extended yeast contact, oxidative notes due to light exposure were more noticeable in taste, while these were less apparent in colour and nose.
The primary aroma reduction trend was most clearly observed in the 2021 vintage and the green-bottled Charmat samples by four tasters, as well as in the 2020 vintage and the white-bottle tank-fermented samples by five tasters, out of the eight panellists. In three samples (2020, 2021 vintages, and green-bottled Charmat), a general trend was observed where low light exposure imparted slight honey-like notes to the tasted sample. This suggests that light-induced processes after low-dose light exposure can also initially produce favourable aromas for consumers. Honey-like notes are often associated with ethyl decanoate (Lund et al., 2009) and certain Maillard-derived compounds (Charnock et al., 2022), suggesting that mild oxidative conditions during the early stage of illumination may transiently enhance these aromas before degradation.
Specific faults indicative of light-struck flavour, such as rancidity, rubber-, onion-, and cabbage-like flavours appeared typically only in the case of higher-dose samples and, apart from the results of one taster in a few cases, were absent from both the control and the low-dose samples. While these trends in the descriptive evaluation are evident, no such patterns are consistently reflected in the numerical scores. This suggests that tasters were more perceptive of changes when not required to assign a score, indicating that descriptive evaluation may be more selective in identifying light-induced attributes as well.
It is important to note the influence of climatic variation on different vintage samples. (cf. Peyrot des Gachons et al., 2005; van Leeuwen & Darriet, 2016) Average annual temperature and precipitation for the 2019, 2020, and 2021 vintages, as well as weather data from August and September, can largely influence the grape’s internal values, which are reflected in vintage differences and the resulting tasting outcomes. Collected data sourced from the official reports of the National Meteorological Service (OMSZ), the Central Statistical Office (KSH), and the reports of the National Council of Wine Communities (HNT) are available as Supplementary material S5.
The considerably high September rainfall in the year 2019 may have increased the risk of rot, which resulted in faster oxidation and aroma loss. (cf. Steel et al., 2013)
The 2020 vintage was the most favourable for winemaking, and its base wine had a low oxidation level. This allowed the wine to preserve its aroma for longer, even under the longest light exposure times, where oxidation was only moderately present.
In 2021, both in August and September, the amount of precipitation was above average. The higher rainfall in both months negatively affected the quality of the wine, resulting in a decrease in aroma intensity.
In summary, changes in weather, especially precipitation, also had a noticeable impact on the grape’s internal values, which was reflected in the vintage differences and tasting results. The favourable weather conditions and precipitation distribution in 2020 facilitated optimal ripening, while in the 2019 and 2021 vintages, the consequences of risk of rot and faster oxidation influenced wine quality. These qualities are also reflected in the descriptive evaluation of the traditional vintage sparkling wines, interfering with the effect of light exposure. When interpreting differences, it is essential to consider that only within-vintage, same-technology comparisons offer a direct measure of light effect without vintage climate confounding.
4. Results of the SRD analysis
SRD analyses – which were based on numerical evaluation by the tasting panel – could not unambiguously distinguish among the samples according to different light doses absorbed either. However, there was some clustering detected in the results concerning both the samples and the panellists. The following figures show the differences from the chosen reference on the horizontal axis as distances. The vertical axis has the same scale, which helps to see the relative values as the height of the bars.
From the clustering of the tasting attributes on Figure 2 we can see that total scores in the case of the 20-point evaluation were largely determined by the attributes ‘Taste and harmony’, ‘Harmony and overall judgement’, as well as ‘Nose’ – as the rankings of these attributes were most similar to that of the total score. As expected, ‘Effervescence’ and ‘Visual aspect’ were the least similar to the ranking of the total score as they were least influenced by the absorbed light dose. The clustering of the 100-point evaluation results is quite similar, though clustering is not so obvious in this case, indicating the influence of the completely randomised blind tasting.
Note that the horizontal and the vertical scales show the same values; this scheme serves to visualise the ranking of different attributes. The reference vector is the total scores of all the panellists in both cases. (a) Clustering of the attributes for the 20-point evaluation sheet; (b) Clustering of the attributes for the 100-point evaluation sheet. 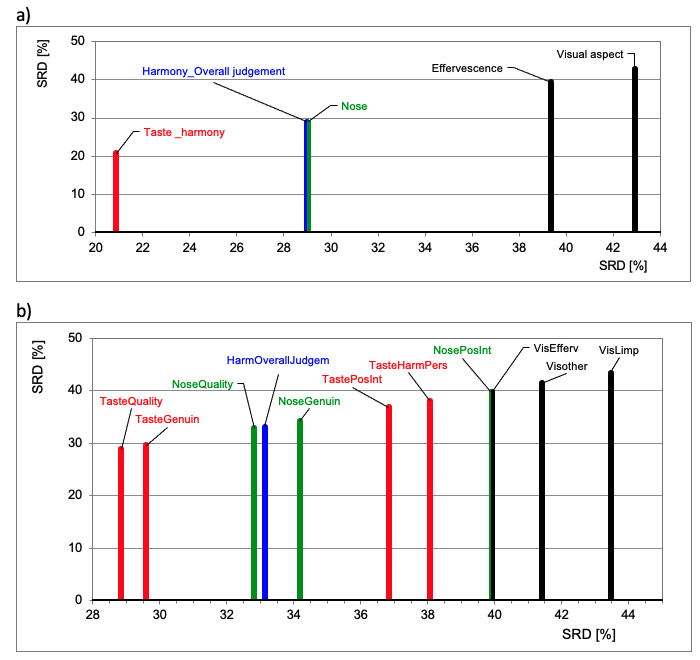
Figure 2. Relative SRD results for tasting attributes.
Figure 3 also shows the clustering of the panellists for both tasting protocols. The difference between the two figures is similar to that of the tasting attributes: the 20-point protocol results in a more pronounced clustering with wine writers being closest to the average pattern, followed by winemakers and Törley staff members, where these two groups overlap. However, in the case of the 100-point protocol, Törley staff members obviously lead the similarity measures with respect to the overall average. A simple explanation is that they are trained to judge the values of sparkling wines and the influence of the completely randomised blind tasting would not mislead them. Wine writers and winemakers are not so consistent if the task is tasting a completely randomised series of sparkling wines with different light doses absorbed. Obviously, the only consumer (without official tasting experience), 4KE, has a particular taste differing considerably from that of the experts.
Note that the horizontal and the vertical scales show the same values; facilitating the visualisation of the ranking of different panellists. The reference vector is the overall average of the scores of all the panellists in both cases. Panellist categories are as follows. Green coloured with a leading ‘1’: Törley staff members; black coloured with a leading ‘2’: wine writers; red coloured with a leading ‘3’: winemakers; beige coloured with a leading ‘4’: consumer. The two letters serve to identify panellists. (a) Clustering of the panellists for the 20-point evaluation sheet; (b) Clustering of the panellists for the 100-point evaluation sheet. 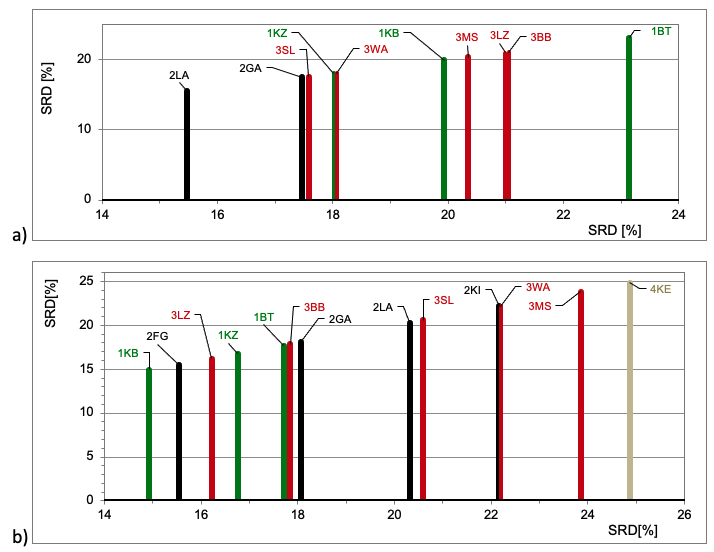
Figure 3. Relative SRD results for panellists.
SRD results for the comparison of the sparkling wines tasted reveal mostly the differences between the non-illuminated control samples. With the 100-point protocol, the highest scores for the control sample and the highest average were obtained for the traditional sparkling wine of the 2021 vintage, and it had equal scores and average to the 2020 vintage (higher than the 2019 vintage) in the case of the 20-point protocol. Thus, the 2021 vintage control sample was chosen to use as reference for the traditional sparkling wines. In the case of the tank-fermented samples, the same wine was filled into both flint and green bottles; thus, the choice of reference – the control sample in green bottle – was somewhat arbitrary, but a sensible one. With these choices, we aimed to compare samples to the highest valued one of each technology, expecting that closer similarities mean better quality of the samples.
As we can see from Figure 4a, the 2019 vintage samples are the least similar to the reference 2021 control sample and its illuminated samples have closely clustered score patterns. The other two vintages (2020 and 2021) are not clustering; thus, they have distinct score patterns depending on the actual light doses absorbed.
In the case of the completely randomised blind tasting according to the 100-point protocol, the 2020 vintage proved to have the most deviating score pattern from the reference 2021 vintage, while the other samples are not showing a clustering tendency.
Note that the horizontal and vertical scales show the same values; facilitating the visualisation of the ranking of different samples. The reference vector is the 2021 vintage control (non-illuminated) sample. (a) Clustering of samples for the 20-point evaluation sheet; (b) Clustering of the samples for the 100-point evaluation sheet. 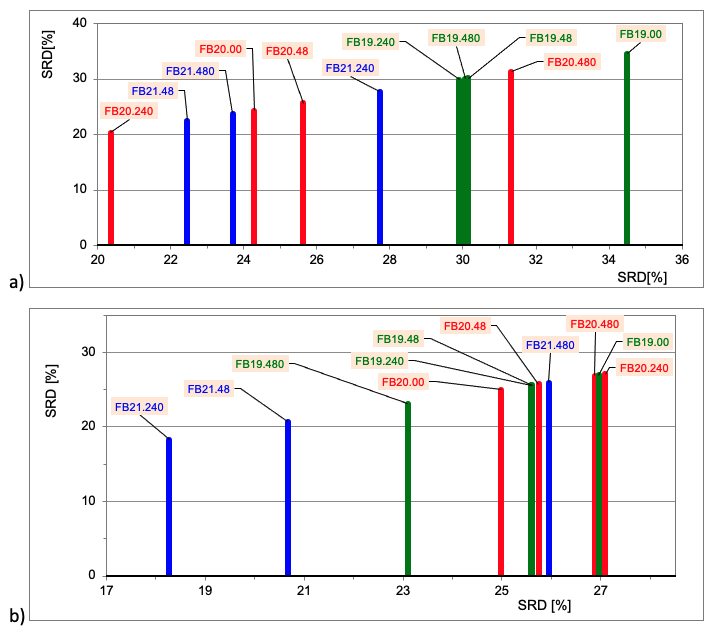
Figure 4. Relative SRD results for the traditional method vintage samples.
Figure 5 shows the SRD results for the Charmat method samples. It is obvious from the 20-point protocol results that the samples in green bottles (CG23) – which received lower doses – are closer in score patterns to the unilluminated reference sample than the ones in flint bottles (CF23). However, in the case of the completely randomised blind tasting according to the 100-point protocol, the clustering of the samples is not that clear-cut.
Note that the horizontal and vertical scales show the same values; this scheme serves to visualise the ranking of different samples. The reference vector is the (non-illuminated) control CG23.00 sample. (a) Clustering of samples for the 20-point evaluation sheet; (b) Clustering of the samples for the 100-point evaluation sheet. 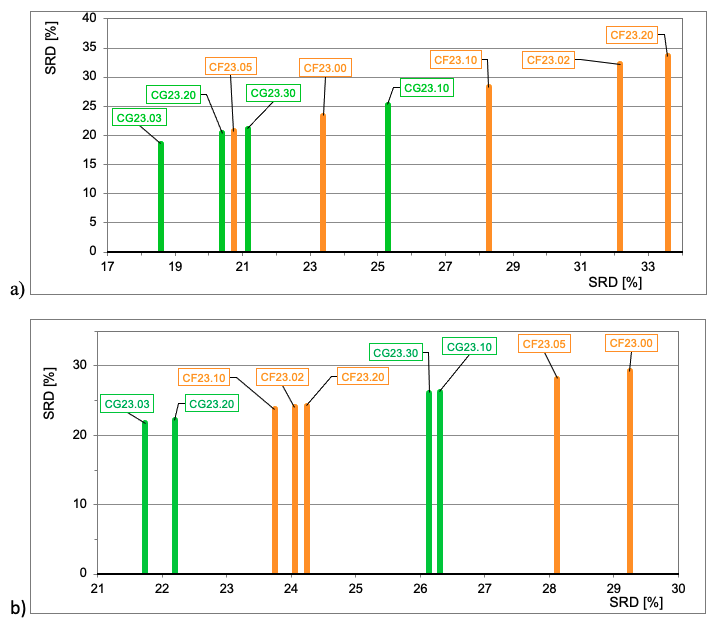
Figure 5. Relative SRD results for the Charmat method samples.
It should be noted that all SRD analysis results deviate significantly from a random ranking (independently of the evaluation protocol, samples or panellists), justifying the above conclusions.
5. Results of the chromatographic analysis
Using the HS-SPME-GC-MS technique, ten major aroma components were traced in the sparkling wine samples as a function of increasing illumination times: ethyl acetate, ethyl butanoate, isoamyl alcohol, ethyl hexanoate, n-hexyl alcohol, ethyl octanoate, ethyl decanoate, ethyl dodecanoate, 2-phenylethanol and n-octanoic acid. All results of these investigations are summarised in the Supplementary material S4. The tracked compounds represent some key contributors to sparkling wine aroma profiles, and consequently their changes under illumination provide a chemical basis for the sensory shifts observed.
The temporal evolution after increasing light doses of some common aromatic compounds exhibits similar patterns to the sensorial tasting results of the descriptive part of the 20-point scorecard. Most of the aroma component concentrations do not follow a monotonically decreasing pattern but evolve frequently through a maximum, in fewer cases through a minimum, and in some exceptional cases, exhibit a minimum after an initial maximum. These patterns are illustrated in case of the sample FB21, the 2021 vintage traditional sparkling wine, in Figure 6.
The vertical axis displays the relative concentration of the aroma compounds in percentages with respect to all detected components in the actual sample, including ethanol. Continuous lines are shown only to guide the eye. Note that ethyl hexanoate (EtHex) and isoamyl alcohol (i-AmylOH) have an initial maximum, then a minimum; ethyl decanoate (EtDec) and ethyl dodecanoate (EtDodec) have an initial minimum and a successive increase — though in the case of EtDec, changes are within the error region, similarly to ethyl acetate (EtAc), which has an initial maximum and a successive decrease. The changes in n-hexyl alcohol (n-HexOH) and ethyl butanoate (EtBut) are rather small; thus, from a sensorial detection point of view, they can be considered as constants. 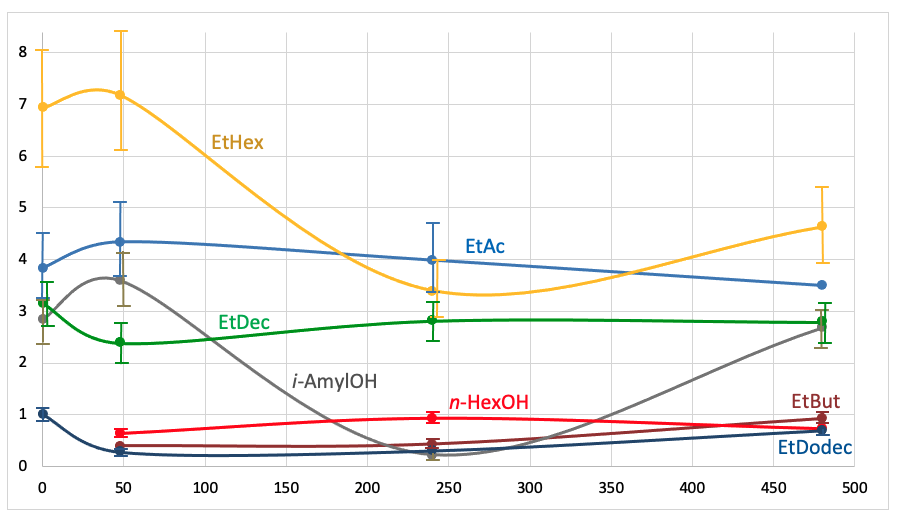
Figure 6. Time evolution of some aroma compounds in the sample FB21, the 2021 vintage traditional sparkling wine, as a function of illumination time in hours.
Some patterns observed in our study shown in Figure 7 are similar to those reported in the publications of Acquaviva et al. (2014) and D’Auria et al. (2009), supporting findings that light-induced aroma changes are not purely degradative but may involve release from precursors, transiently increasing certain volatiles before decline.
Increasing numbers on the horizontal axes designate increasing illumination times (different for CF, CG, and FB samples). Vertical axes are proportional to the relative concentrations of the aroma compounds with respect to all detected components in the actual sample. Connecting lines are shown only to guide the eye. (a) Ethyl octanoate in Charmat sparkling wines in flint (CF23) and green (CG23) bottles, along with the 2021 vintage traditional sparkling wine (FB21). (b) Ethyl hexanoate in Charmat sparkling wines in flint (CF23) and green (CG23) bottles, along with the 2021 vintage traditional sparkling wine (FB21). (c) Ethyl acetate (EtAc) in the 2019 and 2021 vintage traditional sparkling wines, along with ethyl decanoate (EtDec) in the 2019 vintage traditional sparkling wines. 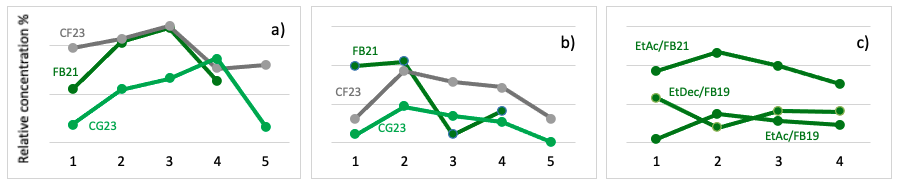
Figure 7. Non-monotonic time evolution of some aroma compounds in selected samples as a function of light dose received.
As previously described, the actual temporal evolution of the concentration of aroma compounds depends on the sort of wine and probably also on the actual technology of winemaking. When comparing the temporal evolution patterns of our samples with those of two previous studies, we can state that we experienced quite similar patterns due to the composition, technology, and vintage of the studied sparkling wine samples.
6. Comparison of the chromatographic and the sensorial tasting results
In the 2019 vintage traditional sample, the concentration of ethyl octanoate – associated with tropical fruit notes – and that of isoamyl alcohol, which contributes to banana-like aromas, increased after 2 days of exposure and decreased after 10 and 20 days. Its rise after short exposure correlates with increased tropical fruit perception in sensory tests, confirming ester-driven aroma enhancement at moderate light doses. A similar trend was observed for ethyl decanoate, typically linked to honey-like notes, though with only a minor decrease. The slower degradation in traditional method wines with extended lees ageing suggests a protective effect of yeast-derived colloids against light-induced breakdown. These patterns align well with the descriptive sensory evaluations, in which panellists noted the presence of honey-like aromas appeared after moderate light exposure.
In the 2020 vintage sample, ethyl octanoate levels doubled after 2 days of exposure and then decreased. Isoamyl alcohol and ethyl acetate concentrations remained relatively constant throughout the 20-days exposure. Ethyl decanoate content markedly increased after 2 days of illumination, changing only slightly after 20 days. This is also in accordance with descriptive evaluations, where panellists perceived honey-like notes after 2 days of exposure, which also lasted until 20 days of illumination.
In the 2021 vintage sample, the most striking feature is the marked decay of both isoamyl alcohol and ethyl hexanoate after 10 days of exposure, then a smaller recovery after 20 days, counteracted by an increase of ethyl octanoate up to 10 days, re-decreasing to the control level after 20 days. In this case, the accordance with the descriptive evaluation is not that clear.
In the 2023 vintage Charmat sparkling wine (which had a different base wine composition than the traditional samples), only the trend in ethyl hexanoate level – associated with green apple and pear notes – as a function of light exposure time is similar to that in the traditional samples; other aroma component concentrations exhibit mostly wavelike behaviour, though with smaller, mostly not significant changes. These Charmat sparkling wine samples have also shown the greatest variation in the sensory evaluations, both in flint and green bottles. Variability in this case may reflect differences in the base wine composition due to reduced protection from phenolic antioxidants compared to traditional sparkling wines.
To sum up the above results, we can emphasise that both tasting sessions in this study aimed to simulate real-life consumer experience: buying a bottle of sparkling wine off the shelf from a retail store without knowing the duration of exposure of the bottle to light. In the case of the 100-point evaluation protocol, tasters did not even know the identity of the wines; the tasting was blind, with the tested 22 samples completely randomised. In case of the 20-point evaluation protocol, tasters knew the identity of the wines in distinct series but the order of tasting of the control and the illuminated samples was randomised; thus, they did not know the light dose the wines absorbed prior to tasting. In this latter case, in addition to assigning scores, tasters also added a descriptive evaluation of sensory attributes. To our knowledge, no such sensory tasting experiments have previously been reported in the literature; most studies were designed to determine only the onset of typical light-strike off-flavour aromas as a function of the duration of light exposure.
As expected, the completely randomised blind tasting (the 100-point protocol) did not result in a significant distinction between samples after increasing light exposure, except when off-aroma components were already clearly perceptible. Assignment of numerical scores in the case of knowledge of the sort of wine (the 20-point protocol) did not result in more precise outcomes either. However, this latter protocol also contained a descriptive evaluation of the tasted samples, and this evaluation resulted in a better distinction of the wines with different light doses absorbed. Obviously, even trained tasters should have some guidelines to perceive these subtle differences. The onset of light-strike off-flavour aromas was also determined with greater certainty this way.
According to our results, there was also a difference between traditional (méthode Champenoise) and tank-fermented (méthode Charmat) sparkling wines. The former benefited from longer ageing durations on lees, which also provided greater resistance to the development of oxidative notes and resulted in more favourable evaluations. (cf. Alexandre & Guilloux-Benatier, 2006; Cravero, 2023) Moderate light exposure enhanced sensory evaluations by promoting honey and brioche attributes, but with extended illumination, these notes gradually diminished as off-flavour notes became more pronounced.
These results also indicate that if consumers simply select a bottle of sparkling wine from the shelf of a wine store, they are not particularly sensitive to light-struck damage after only moderately high light doses, prior to the onset of typical light-struck flavours determining the sensory impressions. They may even appreciate the effect of moderate light doses increasing some pleasant sensory notes resulting in honey-like tastes.
The chromatographic results and the sensory descriptive evaluations generally showed corresponding tendencies. Chromatographic data also support that low-dose light exposure may initially enhance certain desirable aroma components in sparkling wines, with a subsequent decline in intensity or the appearance of light-strike-related sensory changes after higher exposures. This observation offers a novel perspective compared to previous studies, which have predominantly focused on the negative effects of light exposure.
Chromatographic results recorded also support observations reported in recent publications (Acquaviva et al., 2014; D’Auria et al., 2009); quite similar patterns emerged – namely, non-monotonic temporal evolution patterns of varietal aroma compounds which also depend on the variety, composition, technology and vintage of the studied sparkling wine samples.
Conclusion
In conclusion, we can state that the results of this study imply an unprecedented conclusion; that consumers buying sparkling wines from the shelves of retail stores are not sensitive to unsavoury changes induced by light exposure in the sensory quality of sparkling wines prior to the appearance of a perceptible level of typical light-strike off aromas related to sulfur-containing products of photochemical processes. In light of these results, we can suggest an efficient consumer protection method consisting of monitoring the light exposure of bottles on the shelves of retail stores. Once the critical light dose that would result in a noticeable appearance of light-strike off aromas has been absorbed, exposed bottles should no longer be sold.
Acknowledgements
The authors are indebted to Törley Sparkling Wine Cellar for preparing and providing the sparkling wine samples, performing the illumination experiments, and organising the tasting sessions. Cooperation of the members of the tasting panel is also thankfully acknowledged.
Supplementary material containing the list of all samples and their properties measured (Supplementary material S1), detailed results and statistical analysis of the 20-score tasting session (Supplementary material S2) and the 100-score tasting session (Supplementary material S3), original results and statistical analysis of the HS-SPME-GC-MS chromatographic experiments (Supplementary material S4), important climatic data of the relevant vintage years (Supplementary material S5), and the detailed results and statistical evaluation of the descriptive analysis (Supplementary material S6) are available at the Journal website.
References
- Acquaviva, V., D’Auria, M. & Racioppi, R. (2014). Changes in aliphatic ester composition of white wines during exposition to light. An HS-SPME-GC-MS study. Journal of Wine Research, 25(2), 63–74. https://doi.org/10.1080/09571264.2014.888648
- Alexandre, H. & Guilloux-Benatier, M. (2006). Yeast autolysis in sparkling wine – a review. Australian Journal of Grape and Wine Research, 12(2), 119–127. https://doi.org/10.1111/j.1755-0238.2006.tb00051.x
- American Wine Society. (2026). Wine Evaluation Chart. https://americanwinesociety.org/wp-content/uploads/2024/02/AWS_Wine_Evaluation_Chart_2024.docx
- Arapitsas, P., Dalledonne, S., Scholz, M., Catapano, A., Carlin, S. & Mattivi, F. (2020). White wine light-strike fault: A comparison between flint and green glass bottles under the typical supermarket conditions. Food Packaging and Shelf Life 24, 100492. https://doi.org/10.1016/j.fpsl.2020.100492
- Câmara, J.S., Alves, M. A. & Marques, J.C. (2006). Development of headspace solid-phase microextraction-gas chromatography–mass spectrometry methodology for analysis of terpenoids in Madeira wines. Analytica Chimica Acta 555(2), 191–200. https://doi.org/10.1016/j.aca.2005.09.001
- Charnock, H.M., Pickering, G.J. & Kemp, B.S. (2022). The Maillard reaction in traditional method sparkling wine. Frontiers in Microbiology 13:979866. https://doi.org/10.3389/fmicb.2022.979866
- Comité Champagne. (2026). Fiche de dégustation Champagne. https://www.champagne.fr/fr/approfondir/ressources/fiche-de-degustation-champagne
- Cravero, M. C. (2023). Innovations in sparkling wine production: A review on the sensory aspects and the consumer’s point of view. Beverages, 9(3), 80. https://doi.org/10.3390/beverages9030080
- del Rey, R., & Loose, S. (2023). State of the International Wine Market in 2022: New market trends for wines require new strategies. Wine Economics and Policy, 12(1), 3–18. https://doi.org/10.36253/wep-14758
- Dubinina, E.V., Moiseeva, A.A., Andrievskaya, D.V. & Trofimchenko, V.A. (2023). Effect of external factors on the stability of sparkling wine quality during storage. Food Systems 6(2), 130–138. https://doi.org/10.21323/2618-9771-2023-6-2-130-138
- D’Auria, M., Emanuele, L., Mauriello, G. & Racioppi, R. (2003). On the origin of “Goût de Lumière” in champagne. Journal of Photochemistry and Photobiology A: Chemistry, 158. 21–26. https://doi.org/10.1016/S1010-6030(03)00095-9
- D’Auria, M., Emanuele, L. & Racioppi, R. (2009). The effect of heat and light on the composition of some volatile compounds in wine. Food Chemistry 117, 9–14. https://doi.org/10.1016/j.foodchem.2009.03.070
- Fracassetti, D., Di Canito, A., Bodon, R., Messina, N., Vigentini, I., Foschino, R. & Tirelli, A. (2021). Light-struck taste in white wine: Reaction mechanisms, preventive strategies and future perspectives to preserve wine quality. Trends in Food Science & Technology 112, 547–558. https://doi.org/10.1016/j.tifs.2021.04.013
- Fracassetti, D., Gabrielli, M., Encinas, J., Manara, M., Pellegrino, I. & Tirelli, A. (2017). Approaches to prevent the light-struck taste in white wine. Australian Journal of Grape and Wine Research 23(3), 329–333. https://doi.org/10.1111/ajgw.12295
- Grant-Preece, P., Barril, C., Schmidtke, L.M., Scollary, G.R. & Clark, A.C. (2017). Light-induced changes in bottled white wine and underlying photochemical mechanisms. Critical Reviews in Food Science and Nutrition 57(4), 743–754. https://doi.org/10.1080/10408398.2014.919246
- Guld, Z., Nyitrainé Sárdy, D.A., Gere, A. & Rácz, A. (2020). Comparison of sensory evaluation techniques for Hungarian wines, Journal of Chemometrics 34(4), e3219. https://doi.org/10.1002/cem.3219
- Haye, B., Maujean, A., Jacquemin, C. & Feuillat, M. (1977). Contribution à l’étude des « goûts de lumière » dans le vin de Champagne. I. Aspects analytiques – Dosage des mercaptanes et des thiols dans les vins. Connaissance de la vigne et du vin. 11(3). 243–254. https://doi.org/10.20870/oeno-one.1977.11.3.1443
- Héberger, K. (2010). Sum of ranking differences compares methods or models fairly. TrAC Trends in Analytical Chemistry 29(1), 101–109. https://doi.org/10.1016/j.trac.2009.09.009
- Héberger, K. & Kollár-Hunek, K. (2011). Sum of ranking differences for method discrimination and its validation: comparison of ranks with random numbers. Journal of Chemometrics 25(4), 151–158. https://doi.org/10.1002/cem.1320
- Kollár-Hunek, K., Heszberger, J., Kókai, Z., Láng-Lázi, M. & Papp, E.A. (2008). Testing panel consistency with GCAP method in food profile analysis. Journal of Chemometrics 22, 218–226. https://doi.org/10.1002/cem.1135
- Laposa, Z., Vesztergom, S., Kocsis, M. & Keszei, E. (2023). In situ measurement of light transmission into wine bottles and calculation of shelf life. OENO One 57(1), 265–277. https://doi.org/10.20870/oeno-one.2023.57.1.7172
- Lund, C.M., Nicolau, L., Gardner, R.C. & Kilmartin, P.A. (2009). Effect of polyphenols on the perception of key aroma compounds from Sauvignon Blanc wine. Australian Journal of Grape and Wine Research 15, 18–26. https://doi.org/10.1111/j.1755-0238.2008.00028.x
- Mattivi, F., Monetti, A., Vrhovšek, U., Tonon, D. & Andrés-Lacueva, C. (2000). High-performance liquid chromatographic determination of the riboflavin concentration in white wines for predicting their resistance to light. Journal of Chromatography A, 888(1–2), 121–127. https://doi.org/10.1016/S0021-9673(00)00561-6
- Maujean, A., Haye, M., Feuillat, M., Thomas, J.C. & Petit, D. (1978). Contribution à l’étude des « goûts de lumière » dans le vin de Champagne. II. Influence de la lumière sur le potentiel d’oxydoreduction. Corrélation avec la teneur en thiols du vin. Connaissance de la vigne et du vin. 12(4). 277–290. https://doi.org/10.20870/oeno-one.1978.12.4.1427
- Maujean, A. & Seguin, N. (1983). Contribution à l'étude des goûts de lumière dans les vins de Champagne. 3 - Les réactions photochimiques responsables des goûts de lumière dans le vin de Champagne, Sciences des aliments 3(4), 589–601. ISBN: 0240-8813
- Mueller Loose, S., & del Rey, R. (2024). State of the International Wine Markets in 2023. The wine market at a crossroads: Temporary or structural challenges? Wine Economics and Policy, 13(2), 3–14. https://doi.org/10.36253/wep-16395
- Noble, A. C. & Dozon, N. M. (1989). Sensory Study of the Effect of Fluorescent Light on a Sparkling Wine and Its Base Wine. American Journal of Enology and Viticulture 40(4). 265–271. https://www.ajevonline.org/content/40/4/265
- OIV. (2026). OIV standard for international wine and spirituous beverages of vitivinicultural origin competitions. https://www.oiv.int/public/medias/7895/oiv-patronage-competition-norme-ed-2021.pdf
- Peyrot des Gachons, C., van Leeuwen, C., Tominaga, T., Soyer, J.-P., Gaudillère, J.-P. & Dubourdieu, D. (2005). Influence of water and nitrogen deficit on fruit ripening and aroma potential of Vitis vinifera L. cv Sauvignon blanc in field conditions. Journal of the Science of Food and Agriculture, 85(1), 73–85. https://doi.org/10.1002/jsfa.1919
- Steel, C. C., Blackman, J. W. & Schmidtke, L. M. (2013). Grapevine bunch rots: impacts on wine composition, quality, and potential procedures for the removal of wine faults. Journal of Agricultural and Food Chemistry, 61(22), 5189–5206. https://doi.org/10.1021/jf400641r
- Törley Sparkling Wine Cellar. (2026). https://torley.hu/en/index
- van Leeuwen, C. & Darriet, P. (2016). The impact of climate change on viticulture and wine quality. Journal of Wine Economics, 11(1), 150–167. https://doi.org/10.1017/jwe.2015.21
 Views: 389
 XML: 44