

VITICULTURE / Original research article
Abstract
The production of wine is characterised by marked interannual variations, which are exacerbated by climate change. This has significant consequences for the sector’s economic performance. It is imperative to possess early insight into yield potential, as this facilitates effective planning and management of available resources, thereby mitigating the effects of interannual production variability. The objective of this study is to validate the forcing of dormant grapevine buds as a method for assessing grapevine bud fruitfulness and predicting inflorescence number. The trials, which were conducted between 2023 and 2025 in the Dão Demarcated Region, involved the experimental induction of early budbreak in cuttings of Vitis vinifera L. cv. Jaen (2023–2025) and Alfrocheiro (2025) under controlled conditions. Fruitfulness was assessed under both controlled (laboratory) and field conditions, using cuttings from the same vines. Predicted and observed inflorescence numbers were strongly correlated across all seasons and varieties, with R2 between 0.72 and 0.86 and a Mean Absolute Error below 2 inflorescences per vine. Predicted and observed values were statistically equivalent within ±1 inflorescence per vine, and the agreement analyses showed little systematic bias and narrow limits of error. In Jaen, predicted inflorescence numbers were positively related to the number of bunches counted at harvest (R2 = 0.34–0.44); most of the residual error stemmed from the biological transition between inflorescence emergence and harvest rather than from the forcing procedure itself. Together, these results suggest that forced budbreak is a reliable and practical tool for early fruitfulness assessment. It can inform vineyard management decisions such as pruning intensity and crop load adjustment, helping to reduce inter-annual production variability in keeping with growers' production targets.
Introduction
Inherently sensitive to discrepancies between expected and actual production, the wine sector operates in a delicate balance between grape and wine production. Within the European Union (EU), wines bearing a Protected Designation of Origin (PDO/DO) are regulated under a harmonised legal framework (e.g., Regulation No 1308/2013) that requires each designation to specify, in its official product specification, the maximum grape yield permitted per hectare as well as quality and marketing conditions. This compromise between quantity and quality of the harvest has long been a defining feature of wine production (Champagnol, 1984; Ravaz, 1912). Yield prediction for a specific season is a pivotal component of the decision-making process in the wine industry and is essential for the regulatory bodies of all EU Member States across diverse phases of the value chain. This encompasses aspects such as crop management, winemaking in the winery, distribution, marketing, accounting, and strategic operations. Moreover, given that the wine sector is frequently selected as a target in international trade disputes and retaliatory tariff measures (Ridley et al., 2022), exposing producers to sudden demand and price shocks, accurate yield assessment becomes essential for risk mitigation and market stabilisation. The implementation of legislative and technical mechanisms is thus enabled, which, in years characterised by a surplus in production, may potentially lead to the revocation of the DO designation (Cunha et al., 2016).
However, yield prediction poses a multitude of challenges. It is not a single measurement, but rather one characterised by significant interannual and spatial variability. It is influenced by edaphoclimatic conditions, as well as by biotic and abiotic stresses (Cunha et al., 2003), genetic factors (such as variety and rootstock), and crop management practices. These factors cause different physiological responses in the vine, with direct consequences for quality and production (Matese & Di Gennaro, 2015). Conventionally, this is achieved through the process of sampling and measuring three fundamental production components: the number of bunches per vine, the number of berries per bunch, and the mass of the berries. Each of these components is partially responsible for the spatial variability of productivity from year to year (Nuske et al., 2014; Tardaguila et al., 2012).
In the case of grapevines growing in temperate climates, production is gradually established over two seasons (Figure 1). The reproductive cycle unfolds within two overlapping vegetative cycles, with the differentiation of the inflorescence primordia occurring inside the dormant buds during the preceding season, close to the flowering stage of the first cycle, about 18 months before harvest (Cunha et al., 2010). At this stage, the shoot apical meristem undergoes organogenesis, giving rise to a series of undifferentiated primordia, known as anlagen, which subsequently develop into either inflorescence or tendril primordia depending on endogenous and environmental cues (Pratt, 1971; Vasconcelos et al., 2009). The number and fate of these anlagen determine the potential fruitfulness of the bud and, ultimately, the number of bunches that will be expressed in the following growing season (May, 2000; Torregrosa et al., 2021). Unlike many annual species, grapevine flowering does not appear to depend on leaf-derived photoperiodic signalling, as floral initiation is triggered directly at the latent bud meristem rather than via a mobile signal from the leaves (Noyce, 2017).
© Adobe Stock. N°355523884, N°287515389, N°287519855. 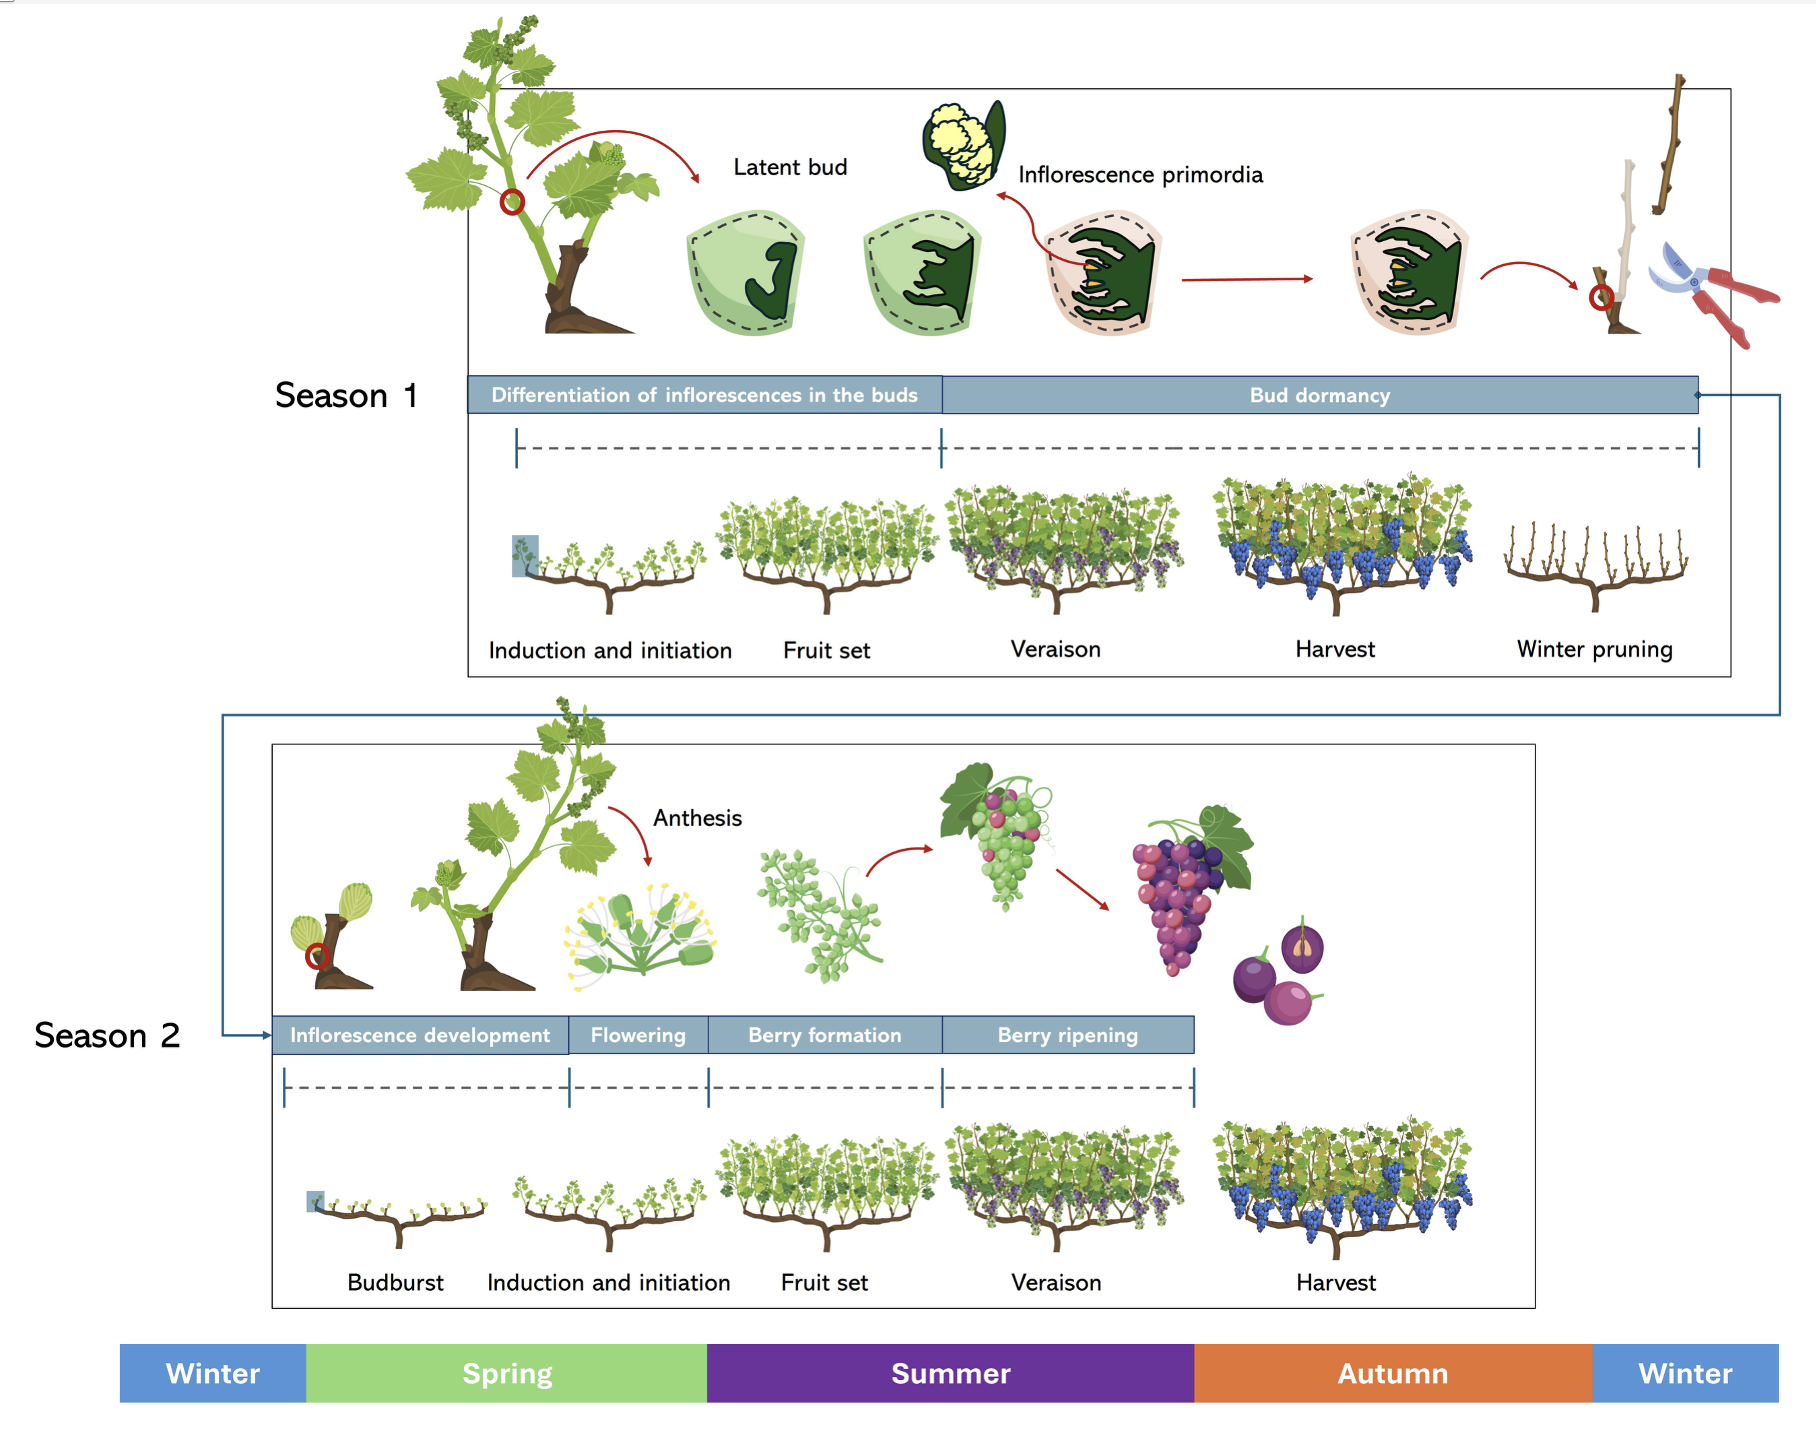
Figure 1. Grapevine annual growth cycle. In Season 1 (top), inflorescence primordia are initiated and differentiated within the latent buds during spring and summer, after which buds enter dormancy through winter. In Season 2 (bottom), following budburst, the previously formed primordia resume development through inflorescence development, flowering (anthesis), berry formation, and berry ripening, culminating in harvest.
Inflorescence initiation and differentiation are strongly influenced by environmental factors such as temperature, light exposure, water availability, and vine carbon status during the period from pre-flowering to fruit set. Warm temperatures and adequate assimilate supply promote the formation of inflorescence primordia, whereas stress conditions, including shading, nitrogen or water deficit, can reduce bud fruitfulness by favouring the development of tendrils instead of reproductive structures (Guilpart et al., 2014; Lebon et al., 2008; Srinivasan & Mullins, 1980). Hormonal regulation also plays a central role, with gibberellins generally inhibiting floral differentiation, while cytokinins and carbohydrate availability promote reproductive development (Boss et al., 2003; Torregrosa et al., 2021).
Once organogenesis is completed, the buds enter a phase of endodormancy, characterised by reduced metabolic activity, altered hormonal balance, and the accumulation of carbohydrate reserves necessary for winter survival and subsequent spring growth (Arora et al., 1953; Faust et al., 1997). Dormancy release and the resumption of meristematic activity are regulated by exposure to chilling temperatures, which modulate gene expression, hormone metabolism, and cellular reactivation processes leading to budbreak (Pellegrino et al., 2020). Molecular studies in grapevine indicate that these developmental transitions are controlled by conserved genetic mechanisms that regulate meristem identity and coordinate the shift from a quiescent to an active developmental state within the latent bud (Carmona et al., 2008). The successful transition from dormancy to bud burst is essential for the expression of the previously established inflorescence primordia and, therefore, for the realisation of the vine’s reproductive potential (Pellegrino et al., 2020).
Counting the number of buds and analysing their fruitfulness index (number of inflorescences per bud) is therefore the first possible measure of potential yield. However, it is not assumed to be a constant value, as it depends on numerous factors, such as the variety, type (primary or secondary) and position of the bud on the cane, edaphoclimatic conditions and the physiology of the vine itself, which influence the differentiation of the inflorescence primordia (Magalhães, 2015). The determination of yield components at this stage opens up prospects for establishing an "ultra-early" grapevine yield prediction, which would be of great relevance to improve the efficiency of vineyard and winery operations. In contrast, prediction methods applied later in the vegetative cycle, once inflorescences have already emerged, may support operational decisions based on expected production levels, but they offer limited capacity to modify the previously established yield potential. For instance, while certain practices such as irrigation management or bunch thinning may influence final yield, these interventions often involve high economic and operational costs. Conversely, ultra-early prediction provides a strategic opportunity to act directly on yield potential through adjustments in pruning severity and bud load. In seasons where ultra-early predictions indicate low yield potential, pruning strategies can be adapted by retaining a higher bud load in order to partially compensate for the anticipated yield reduction. Thus, modifying the number of retained buds allows growers to align potential yield with economic expectations and the winery’s business model. Gaining a better understanding of the physiology of inflorescence formation remains an objective of considerable economic importance, as well as intellectual interest (Clingeleffer & Krstic, 2001).
During the dormancy phase of the vine, the identification and quantification of bud fruitfulness is challenging and necessitates the implementation of specific laboratory techniques (Monteiro et al., 2021). The dissection and histological analysis of buds are the main techniques used to determine potential fruitfulness. The dormant bud dissection method involves the microscopic observation of inflorescence primordia using a stereomicroscope following small cuts, made from top to bottom towards the base or in the longitudinal direction (Martínez de Toda, 1991; Ramos, 1991). Histological analysis involves embedding grapevine buds in paraffin wax, followed by serial sectioning, staining, and observation under an optical microscope to visualise reproductive structures (Martínez de Toda, 1991), offering higher resolution and allowing a more precise characterisation of the internal organisation of the meristematic tissues. However, these methods are time-consuming, limited and necessarily destructive in order to visualise the early stages of inflorescence. Bud scales and epidermal hairs should be removed to ensure proper fixation and tissue preservation. Specialised knowledge of bud anatomy and precision is required to identify and avoid damaging the fragile meristematic structures, which are small in size, and some of the undifferentiated inflorescences may not be detected or may be counted incorrectly (Laurent et al., 2021). In recent years, to overcome the limitations of the previous methods, non-destructive and high-throughput methods have been explored, such as Micro-computed tomography (micro-CT), since it allows the visualisation of internal bud structures in three dimensions without dissection, offering a rapid and repeatable way to detect inflorescence primordia (Kovaleski et al., 2019; Ritter et al., 2024; Signorelli et al., 2019). Although promising, this technology remains costly and also requires specialised equipment and knowledge.
The investment of time and effort required by these techniques may be impractical from an operational point of view for the wine sector (Clingeleffer & Krstic, 2001) especially for small-scale producers, who often lack the necessary knowledge, resources and equipment. Alternatively, the process of inducing budbreak in dormant buds in a controlled environment, previously described by May and Antcliffe (1973) has emerged as a technique that allows producers to make early yield estimates and serves as a basis for managing operations such as winter pruning to adjust production to the needs of the company according to a given business model (Clingeleffer & Krstic, 2001; Khanduja & Abbas, 2017; May, 1961). The process of forcing buds entails the collection of canes containing one or more dormant buds, followed by subjecting them to controlled conditions of temperature, relative humidity and photoperiod to induce budbreak. The bud fruitfulness assessment is determined by a visual examination and enumeration of the inflorescences that have emerged (Khanduja & Abbas, 2017; May, 1961; Ramos, 1991). Plant material can be collected during dormancy; however, if buds are still in endodormancy and have not fulfilled their chilling requirement, chemical or physical treatments may be applied to induce budbreak. Although it does not predict the effects of climatic events and diseases that may occur during the crop cycle, the procedure is methodologically simple and allows for a more representative sample to be obtained.
Although forced budbreak has previously been used to assess grapevine bud fruitfulness, its predictive agreement with field-expressed inflorescence number has not been sufficiently quantified across seasons at the individual-vine and bud-position levels. In this context, the present study aimed to validate the forcing of dormant grapevine buds under controlled environmental conditions as a physiology-based approach for ultra-early assessment of bud fruitfulness and vine yield potential, up to a full growing season before harvest. By comparing laboratory-derived (controlled environment) fruitfulness estimates with field observations across multiple seasons and varieties, this work evaluates the accuracy and consistency of forced budbreak as a tool for the early assessment of yield potential and vineyard management support.
Materials and methods
1. Plant site description
The experimental trials were conducted in 2023, 2024 and 2025 in the Dão Demarcated Region, more specifically at Quinta da Cale (Latitude 40° 31’N, Longitude 7° 51’W, Elevation 440 m), belonging to the Dão Viticultural Studies Centre (CEVD), Center Regional Coordination and Development Commission (CCDRC), Nelas Innovation Hub, Viseu, Portugal.
The experimental plot was established in 1999 with Vitis vinifera L. cv. Jaen and cv. Alfrocheiro, both grafted onto 110R rootstock, at a 2.00 × 1.10 m spacing (inter-row × intra-row). Vines are trained to a bilateral Royat cordon system with six fruiting units per vine. The same canopy management operations were applied in all three study seasons. Shoot thinning was carried out when shoots reached approximately 15 cm in length, removing all shoots not originating from retained pruning buds, as well as those arising from secondary buds. Basal leaf removal was applied to the east-facing side of the canopy at the lead-shot to pea-size berry stage, and shoot topping was carried out at bunch closure. Preventive phytosanitary treatments against powdery mildew (Erysiphe necator) and downy mildew (Plasmopara viticola) were applied throughout the growing season.
The vines are planted in cambisols (Food Agriculture Organization of the United Nations, 1998) of granitic origin (97 % in the region), with a light texture, porous and permeable, with low water retention capacity and low organic matter content (Rodrigues et al., 2012). The region’s climate, classified as Csb in the Köppen–Geiger climate classification, is characterised as temperate and sub-humid (Santos et al., 2020); cold and rainy in winter, but very hot and dry in the summer months, with microclimatic variations that are of great importance for wine quality.
Climatic conditions during the three study seasons were characterised using monthly total precipitation (mm) and mean air temperature (°C) data obtained from Viseu meteorological station. These values were compared with the 1971–2000 climatological normal (mean annual temperature of 13.7 °C; total annual precipitation of 1165.5 mm) to assess deviations from historical patterns (Figure 2).
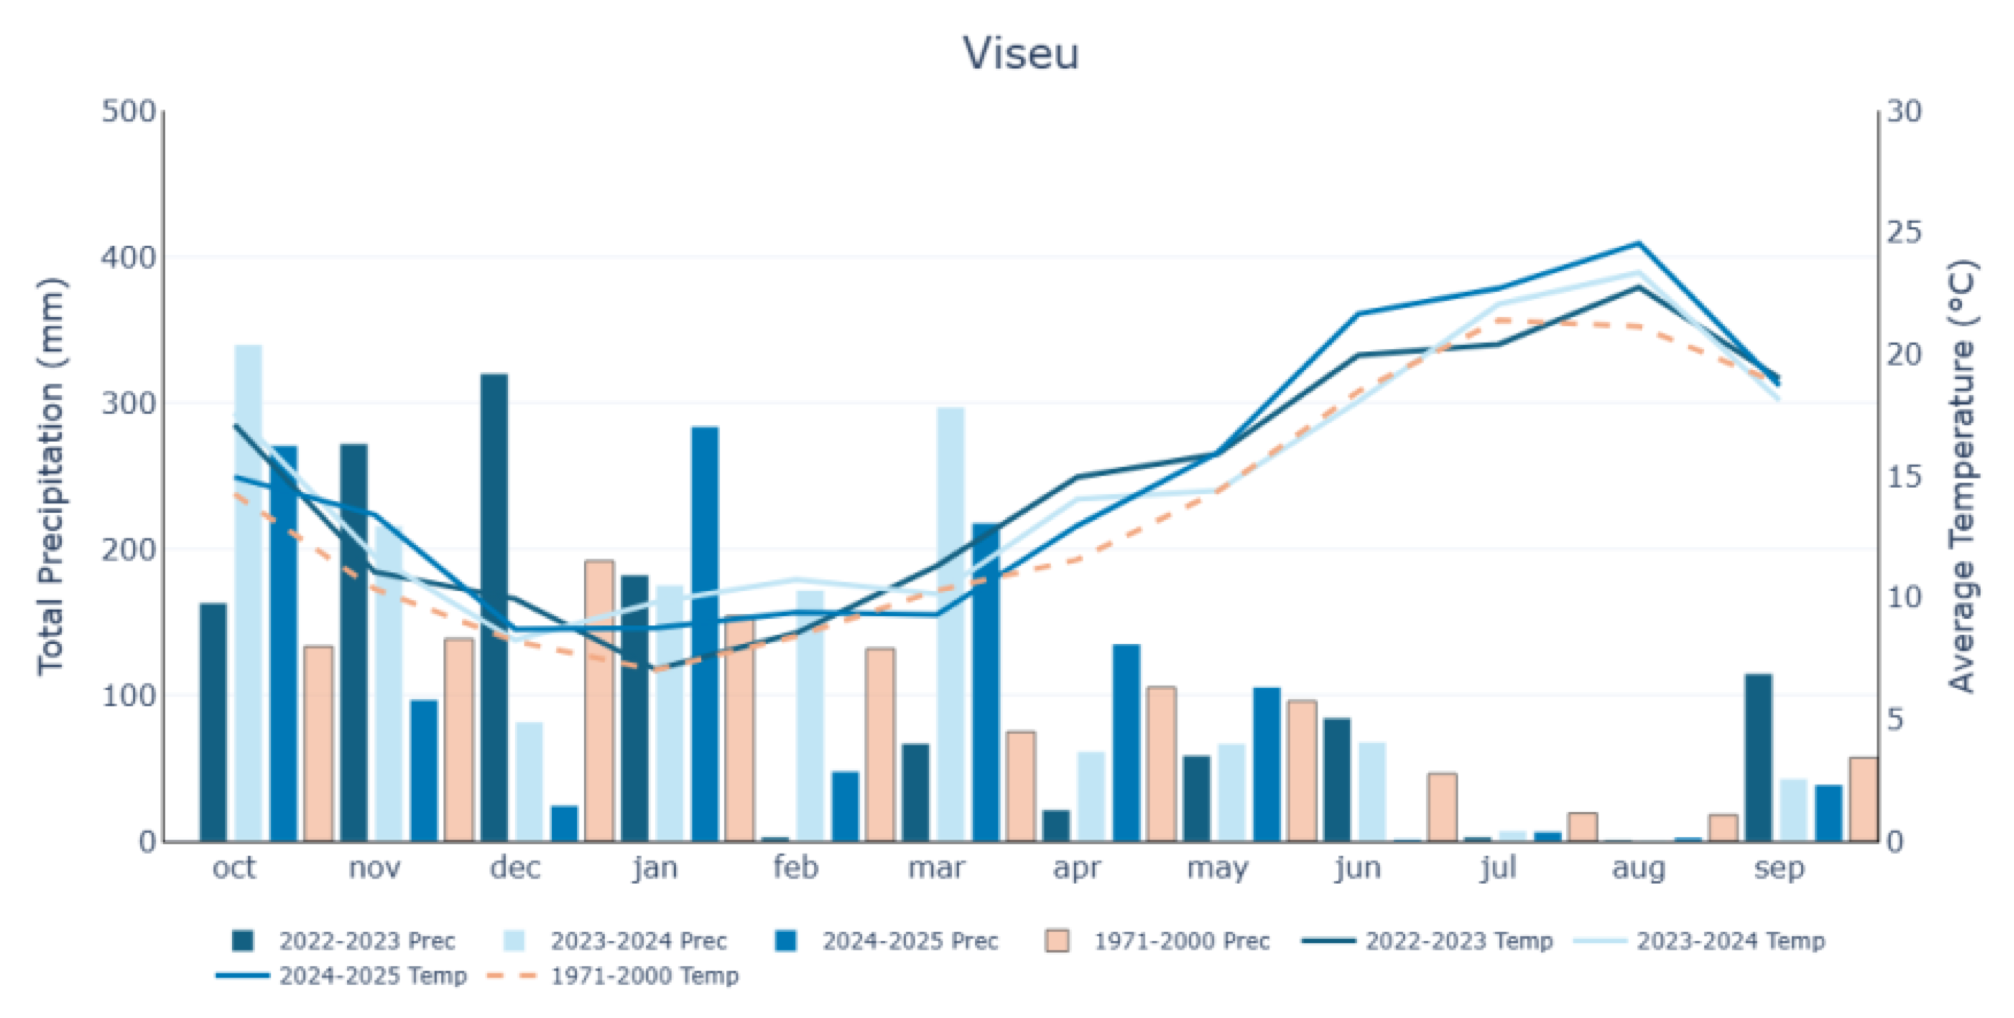
Figure 2. Monthly total precipitation (vertical bars) and monthly average temperature (lines) recorded in Viseu, Portugal, during the years being studied and the long-term average 1971–2000.
All three seasons were warmer than the long-term average, with mean annual temperatures of 14.8 °C, 14.9 °C, and 15.1 °C for 2022/2023, 2023/2024, and 2024/2025, respectively, corresponding to positive deviations of +1.1 °C, +1.2 °C, and +1.4 °C (IPMA, 2023a; IPMA, 2023b). Total annual precipitation was 1290.8 mm (+10.8 %), 1529.3 mm (+31.2 %), and 1231.2 mm (+5.6 %), respectively. Precipitation distribution showed a consistent pattern across years: the dormancy period (October–March) was wetter than the climatological normal (+22.3 %, +55.6 %, and +14.3 %), while the growing season (April–September) was drier (−17.1 %, −27.6 %, and −15.2 %), with particularly low rainfall during July and August across all three seasons. These climatic data were used to contextualise the reproductive responses observed across seasons
2. Forcing budbreak
Figure 3 summarises the stages and main procedures in the execution of the forcing test for the three years under study. During the winter dormancy of the 2022/2023, 2023/2024, and 2024/2025 seasons, 216 vines were sampled (4 blocks × 3 rows × 3 vine positions × 6 vines), including the Jaen (2023–2025) and Alfrocheiro (2025) varieties grown in the same plot, and from each vine up to six one-year-old canes (previous season’s wood) were collected for analysis. To ensure that dormancy was broken, the plant material was stored at a temperature of 6 °C in a refrigerated chamber. After dormancy release, the canes were cut and divided into short sections containing only buds from the first and second basal positions (levels 1 and 2), in accordance with the pruning system used. Due to the short size of these cuttings and to eliminate competitive interactions and apical dominance effects between buds on the same cutting, one of the buds was removed depending on the position to be evaluated. In total, 2170 single-bud cuttings were evaluated across the three seasons: 1382 of Jaen (477, 470, and 401 in 2022/2023, 2023/2024, and 2024/2025, respectively) and 787 of Alfrocheiro (2024/2025), with an approximately equal distribution between bud levels 1 and 2 in all year × variety combinations (Table 1). The cuttings were planted in alveolar trays (60.5 cm × 40.6 cm × 5.5 cm) with sterilised peat, which were kept in the laboratory at a temperature of around 25 °C and relative humidity of 75 %, with a photoperiod of 12 hours. The samples were irrigated whenever necessary to restore substrate moisture. The inflorescences became visible (BBCH 53) approximately 10 to 20 days after planting the cuttings.
© Adobe Stock. N°355523884, N°287515389, N°287519855, N°196117510. 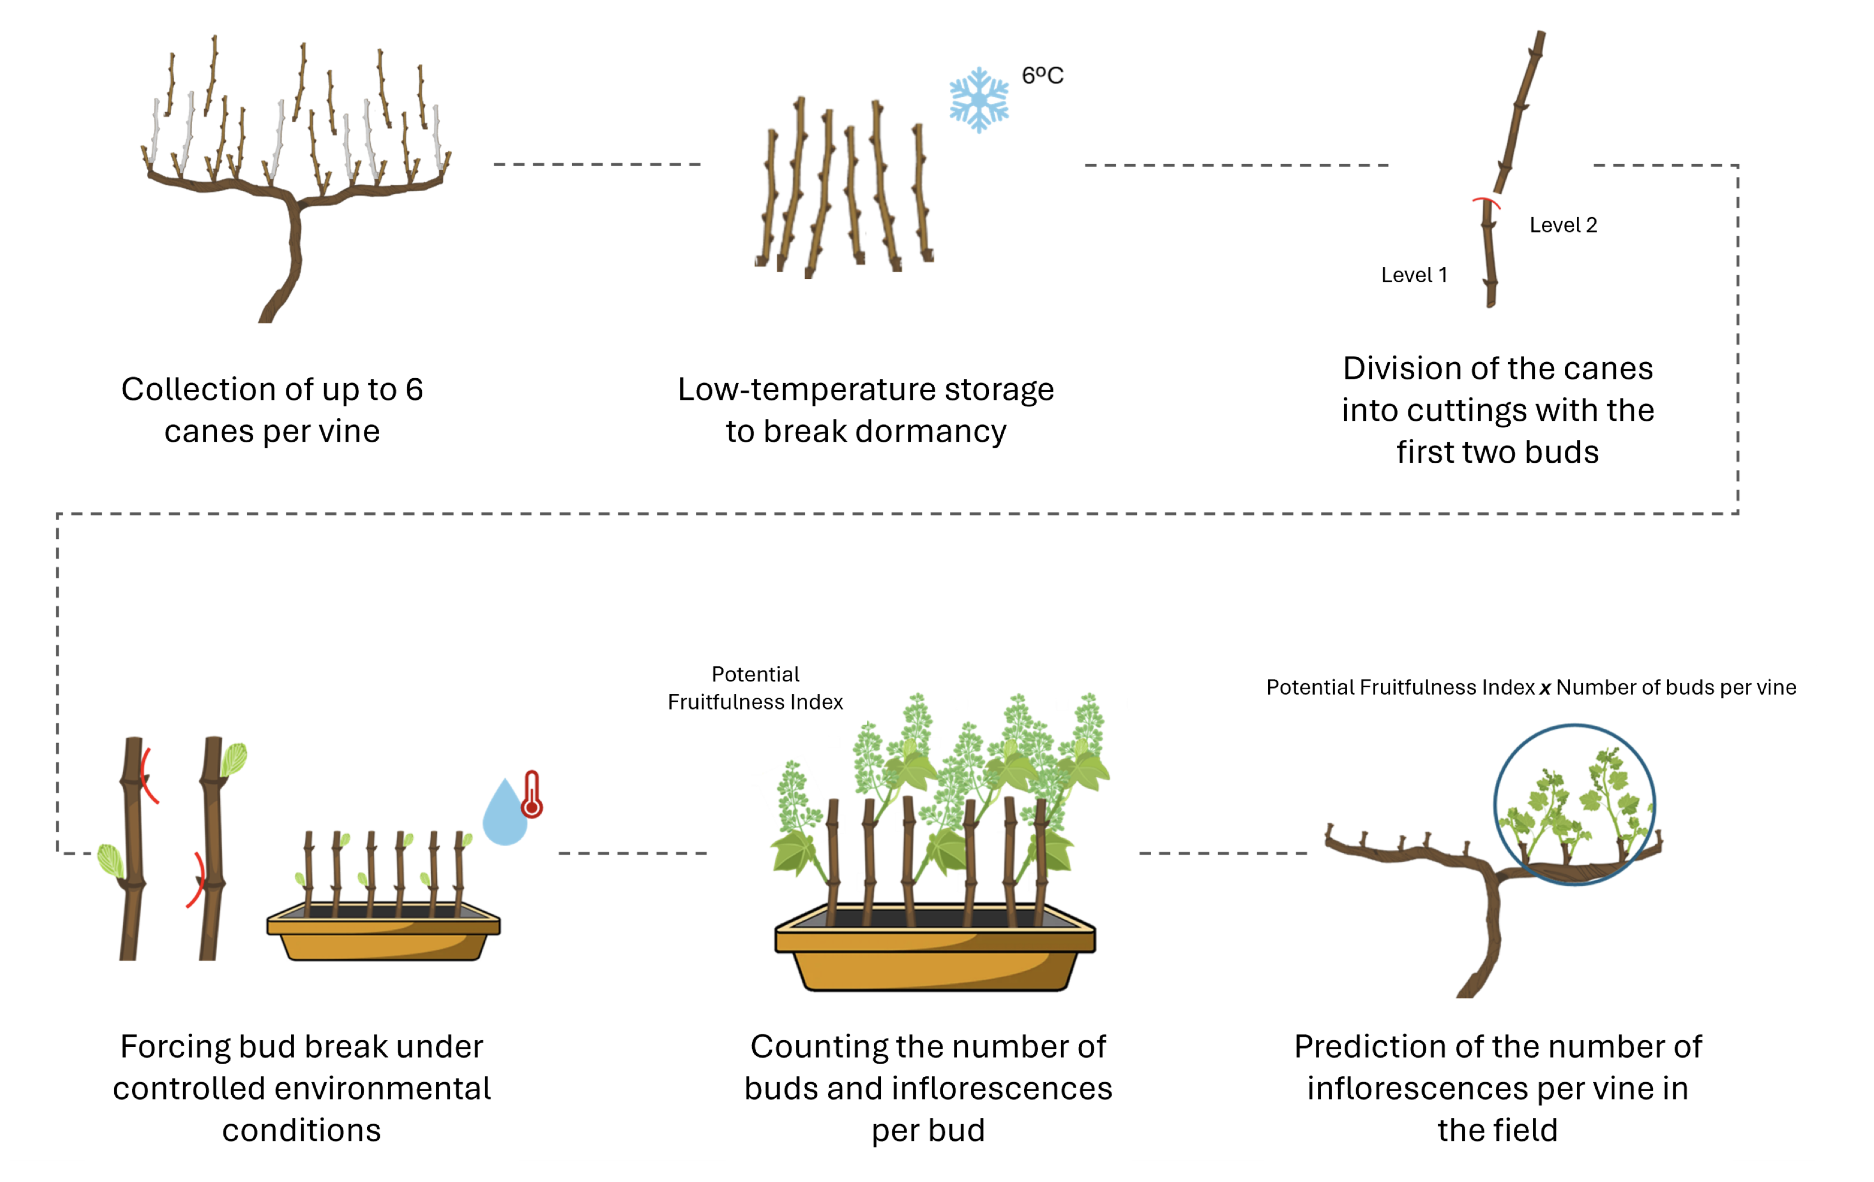
Figure 3. Main procedures followed for conducting budbreak forcing tests in controlled environmental conditions and inflorescence prediction in the field.
Season | Variety | Level 1 | Level 2 | Total |
|---|---|---|---|---|
2022/2023 | Jaen | 240 | 237 | 477 |
2023/2024 | Jaen | 235 | 235 | 470 |
2024/2025 | Jaen | 202 | 199 | 401 |
2024/2025 | Alfrocheiro | 395 | 392 | 787 |
3. Bud fruitfulness assessment
In the laboratory, after budbreak and inflorescence emergence (Figure 4), the number of buds that had burst (BBlab) and inflorescences (Ilab) per bud were counted to calculate the average potential fruitfulness index (IFpot) for each of the levels evaluated (Equation 1). Budbreak percentage was calculated as the ratio between the number of buds that burst (BBlab) and the total number of cuttings planted, expressed as a percentage. Vine levels for which buds failed to burst under laboratory conditions were excluded from both laboratory and field datasets. This exclusion was applied because laboratory non-bursting can result from technical factors unrelated to bud fruitfulness (e.g., physical damage to cuttings, fungal contamination, cutting desiccation), which would otherwise conflate experimental attrition with biological unfruitfulness. The symmetric exclusion applied to the field dataset ensured complete correspondence between predicted and observed values at each bud position, so that only valid and biologically meaningful data were included in the analysis. The fruitfulness of dormant buds determined by forcing budburst under controlled conditions was subsequently compared with fruitfulness estimates observed in the field, considering bud position as well as mean values per vine. Statistical analyses were performed to assess the presence of significant differences between bud fruitfulness obtained under controlled laboratory conditions and that expressed under field conditions.
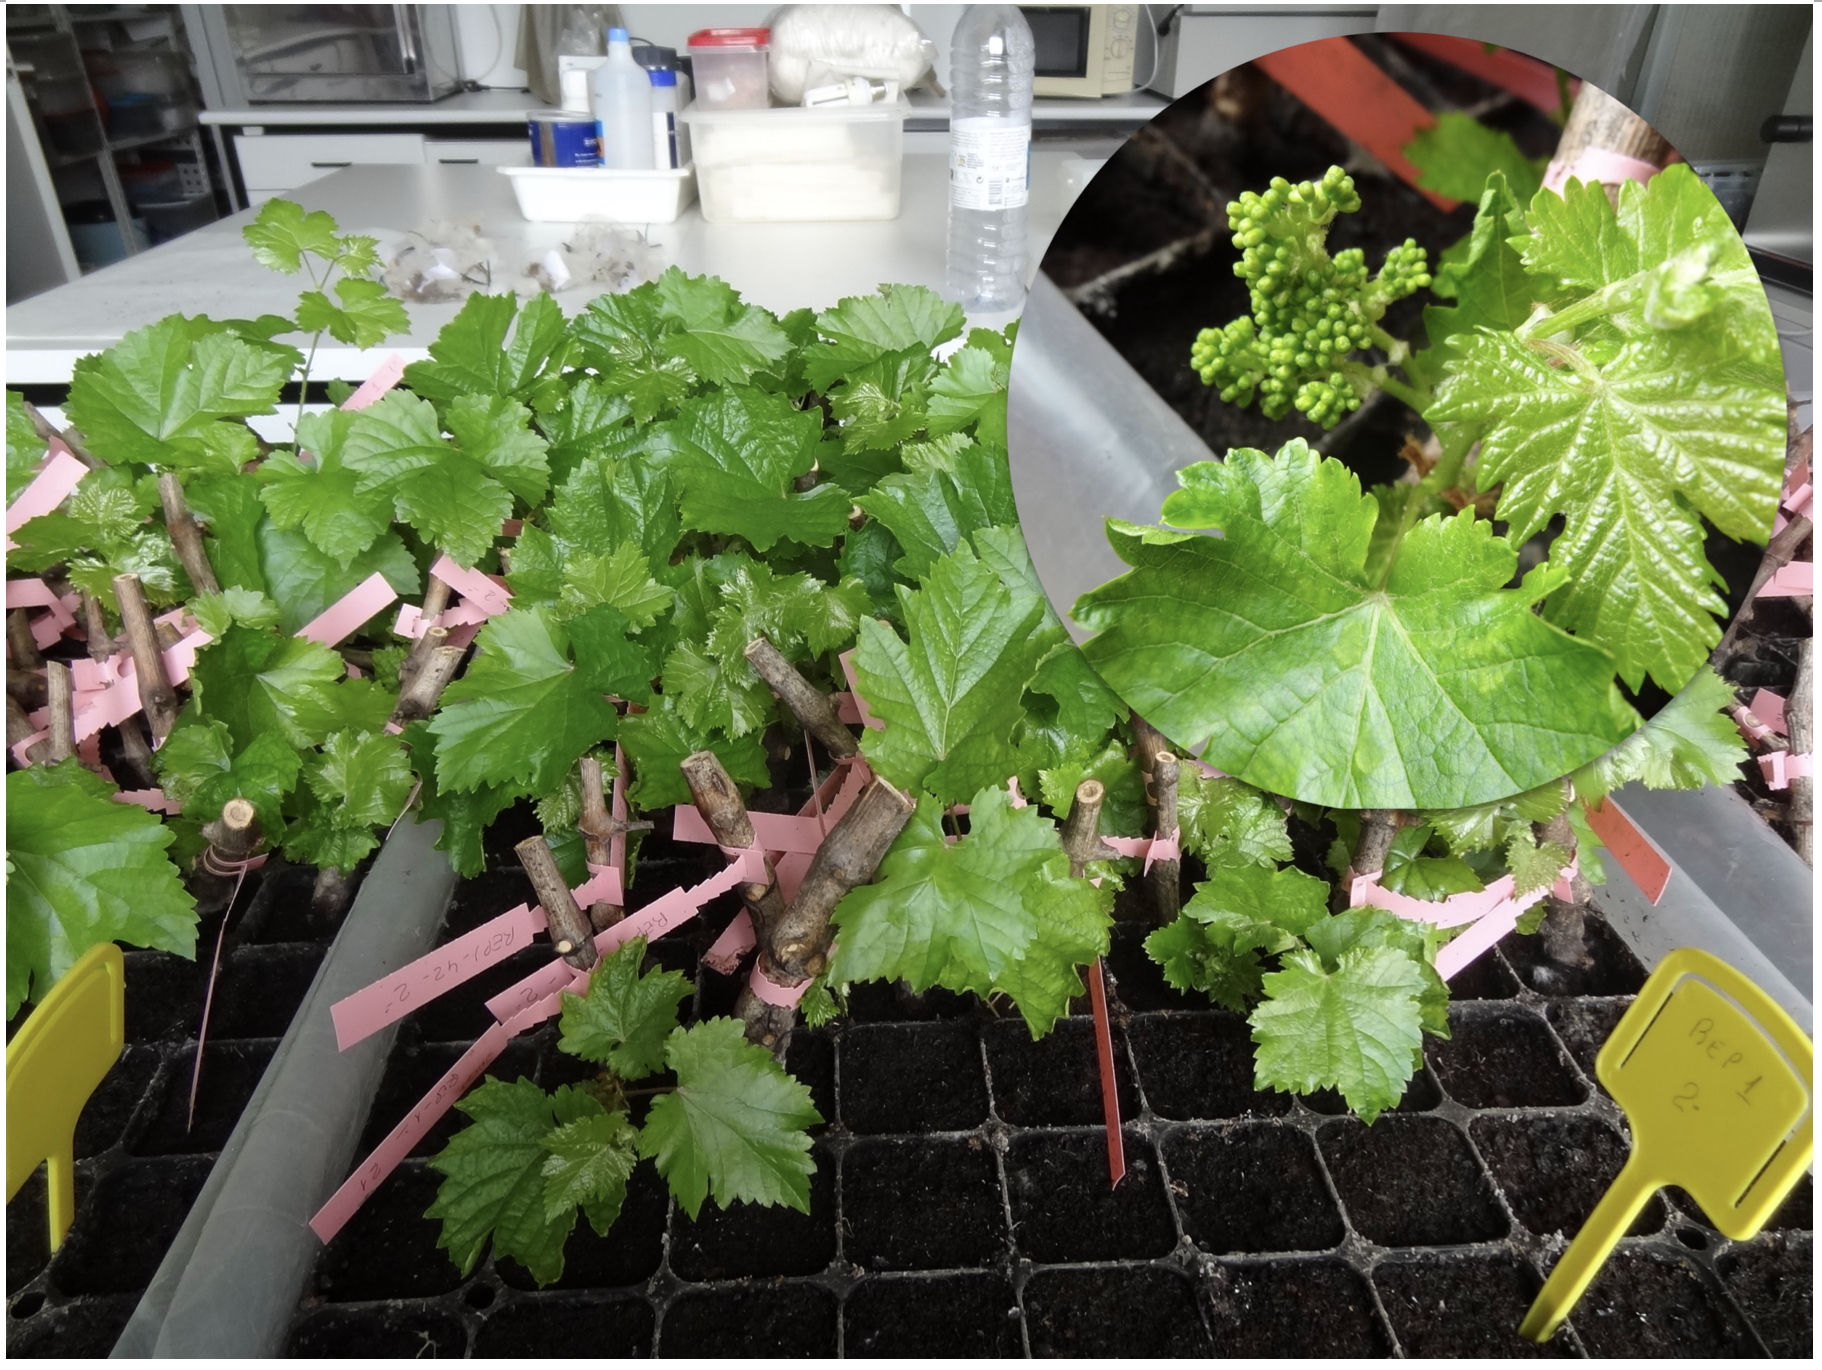
Figure 4. Growth of Jaen variety cuttings in a controlled environment. Highlight of the visible inflorescence emergence stage.
In the field, to predict the number of inflorescences to emerge (Ipred) for each vine, a function was defined based on the average IFpot calculated in the laboratory and the number of buds remaining after pruning each vine in the field (BPfield) (Equation 2). Subsequently, during the flowering stage, fruitfulness was assessed in the field on the respective sampled vines by counting the number of buds that had sprouted and inflorescences that had emerged.
Predicted inflorescence numbers from controlled conditions were compared with field observations using a four-block experimental design. Because some canes were insufficient, buds were absent, or buds failed to burst in the field, sample sizes were unbalanced across blocks and years. Statistical equivalence between predicted and observed inflorescences per vine was tested with the two one-sided tests (TOST) procedure applied to paired differences. Equivalence was concluded when both one-sided tests were significant at p = 0.05, meaning the 90 % confidence intervals fell entirely within predefined equivalence margins. An equivalence threshold of ±1 inflorescence per vine was adopted, corresponding to the smallest meaningful difference given the discrete nature of inflorescence counts, thereby providing a conservative test of predictive accuracy. Agreement and systematic bias were assessed through Bland–Altman analysis: for each variety and season, the mean difference between predicted and observed values (bias) and the 95 % limits of agreement (LOA) were calculated. The LOA were defined as shown in Equation 3 (Equation 3), where represents the bias, and 𝑆𝐷𝐷 represents the standard deviation of paired differences.
To further evaluate model performance, linear regression analyses were conducted for each season and variety to assess the relationship between predicted and observed numbers of inflorescences, and the coefficient of determination (𝑅2) (Equation 4) was used to quantify the proportion of variance explained by the model. In addition, prediction accuracy was assessed using the mean absolute error (MAE) (Equation 5), which provides a measure of the average magnitude of prediction errors independent of their direction.
Following the evaluation of predicted and observed inflorescences, a harvest-stage validation was performed to assess whether the ultra-early prediction was retained until harvest. This analysis was conducted only for the Jaen variety, because harvest data were not available for the Alfrocheiro variety. Predicted inflorescences per vine were compared with the number of bunches counted at harvest on the same vines. Since harvest data were not discriminated by bud level, only vines for which predicted inflorescence number could be calculated using both evaluated bud levels were retained in this analysis. Consequently, the number of samples used for the harvest-stage validation was lower than that used for the inflorescence prediction analysis. Cross-season comparisons of bunch number, bunch weight and yield in the harvested subsamples are therefore reported as descriptive context and not as a formal test of seasonal differences.
At harvest, bunch number and total fruit mass were recorded for each selected vine. Observed yield was expressed as kg/vine, and mean bunch weight was calculated as the ratio between total fruit mass and the number of harvested bunches. The relationship between predicted inflorescences and observed bunch number at harvest was evaluated using the same prediction performance metrics described above, including MAE, Bland–Altman bias, TOST equivalence testing and LOA. Because final bunch number is influenced not only by bud fruitfulness but also by post-budbreak processes, equivalence margins of ±2 bunches per vine were considered more appropriate for harvest-level prediction than the stricter ±1 margin used for inflorescence prediction.
To evaluate how forced budbreak could be translated into yield predictions (Ypred), the predicted number of inflorescences per vine (Ipred) was combined with a fixed inflorescence-to-bunch ratio (IBratio) and a fixed mean bunch weight (Wbunch), each taken as the mean of the three seasonal values (6). The inflorescence-to-bunch ratio of each season was calculated as the total number of bunches observed at harvest divided by the total number of predicted inflorescences (Equation 6).
No equivalence test was applied to yield predictions, since this analysis was intended as a proof-of-concept conversion of predicted reproductive potential into yield.
Results and discussion
1. Seasonal and varietal differences in bud fruitfulness
Table 2 presents the total number of buds that burst and inflorescences that emerged from the sampled vines, as well as the average IFpot according to bud position along the cane. In the field, the budburst rate exceeded 98 %, whereas under laboratory conditions, it was considerably lower, particularly in 2022/2023, when only 36 % of the buds sprouted. Although inhibition relationships between buds on the same vine were avoided, physical damage (broken cuttings or buds) or the incidence of fungal diseases affected the budbreak rate under controlled conditions.
Source | Season | Variety | No. Vines | No. Buds | No. Buds burst | Budbreak (%) | No. Inflo | IFpot Level 1 | IFpot Level 2 |
|---|---|---|---|---|---|---|---|---|---|
Laboratory | 2022/2023 2023/2024 2024/2025 2024/2025 | Jaen Jaen Jaen Alfrocheiro | 147 153 158 161 | 477 470 401 787 | 174 376 267 575 | 36.50 80.00 66.58 73.72 | 255 498 134 485 | 1.30 1.14 0.87 1.13 | 1.58 1.52 0.83 1.71 |
Field | 2022/2023 2023/2024 2024/2025 2024/2025 | Jaen Jaen Jaen Alfrocheiro | 147 153 158 161 | 1137 1292 1314 1657 | 1120 1268 1307 1646 | 98.50 98.14 99.47 | 1578 1649 1085 2280 | 1.30 1.14 0.76 1.22 | 1.62 1.43 0.93 1.57 |
Nevertheless, mean IF values were highly consistent between laboratory and field samples for each bud position evaluated throughout the three-year study, with differences remaining below 0.15 across all bud positions, years, and varieties. Regarding the Jaen variety, in 2022/2023, the average IFpot at level 1 was similar in both conditions (1.30), while at level 2, field fruitfulness was slightly higher (1.62) compared to the laboratory (1.58). The dynamics were reversed in 2023/2024, with the average IFpot at level 1 remaining identical (1.14) in both the laboratory and the field, but with an increase in fruitfulness in level 2 buds in the laboratory (1.52), surpassing the field (1.43). In the 2024/2025 season, the laboratory again showed greater fruitfulness at level 1 (0.87 vs 0.76 in the field), whereas at level 2 the trend inverted, with field buds presenting a higher IFpot (0.93) compared to the laboratory (0.83). For the Alfrocheiro variety in 2024/2025, the laboratory exhibited higher fruitfulness at level 2 (1.71 vs 1.57 in the field), while at level 1 the field showed a slightly higher IFpot (1.22) than the laboratory (1.13). Among buds, there was greater fruitfulness overall in level 2 buds compared to level 1 buds in both years, varieties and conditions.
The Jaen and Alfrocheiro varieties are characterised by their high fruitfulness, even in basal buds (Böhm, 2007), as demonstrated by the results obtained (0.83 < IFpot < 1.71). However, different varieties can exhibit different responses in terms of bud position, which can be explained by the inhibition of basal budbreak due to apical dominance (Magalhães, 2015). Monteiro et al. (2022), through the technique of forcing budbreak under controlled conditions, observed significant differences in fruitfulness between the Alvarinho, Fernão-Pires and Loureiro wine grape varieties during two seasons (2016/2017 and 2017/2018). Although it is largely genotype-dependent, the effect of environmental (abiotic) factors, such as temperature, light, water status, and macronutrient availability, also impacts not only the intensity and homogeneity of budbreak, but also bud fruitfulness (Monteiro et al., 2022).
In the present study, the Jaen variety exhibited a progressive decline in bud fruitfulness from 2023 to 2025, highlighting a strong environmental component. During the late spring and early summer of 2022/2023, when floral induction and differentiation occur within latent buds, temperatures were above the long-term average (Figure 2) but remained within the range generally considered favourable for inflorescence formation (20 to 35 °C) (Buttrose, 1969; Buttrose, 1970). Under these conditions, since mean temperatures during the critical induction period remained within the range generally considered favourable, temperature alone is unlikely to have directly limited induction. However, the concomitant occurrence of irregular and below-average precipitation may have constrained vine water status and assimilate availability, which are known to influence the quality and stability of inflorescence primordia and, consequently, the fruitfulness expressed in the following season (Buttrose, 1974; Magalhães, 2015). In contrast, the 2023/2024 season was characterised by exceptionally high spring precipitation, a condition conducive to increased vegetative vigour and canopy shading. Excessive vigour and reduced light availability in the renewal zone have been consistently associated with lower bud fruitfulness (Cunha et al., 2010; Keller et al., 2005), providing a plausible explanation for the pronounced reduction in fruitfulness observed in Jaen in 2024/2025, particularly under field conditions.
Winter thermal conditions further modulated the expression of reproductive potential. The winters of 2022/2023 and especially 2023/2024 were anomalously warm (IPMA, 2023a; IPMA, 2023b), implying reduced chilling accumulation. Insufficient winter chilling does not affect the number of inflorescence primordia already formed but can impair dormancy release and the uniformity of budbreak, thereby limiting the effective expression of bud fruitfulness (Anzanello et al., 2018). The persistence of warm winters into 2024/2025 suggests a cumulative constraint on fruitfulness expression. The contrasting response of Alfrocheiro in 2024/2025, which showed a higher fruitfulness index under the same climatic conditions associated with the lowest values observed in Jaen, suggests that cultivar-specific traits may influence bud fruitfulness. Together with the interannual variation observed in Jaen, these results indicate that bud fruitfulness is shaped by both seasonal environmental conditions and genetic background. These results suggest that bud fruitfulness is influenced by both cultivar-specific traits and seasonal thermal and hydric conditions affecting the formation and expression of reproductive potential. However, their relative contributions and possible interactions require evaluation across multiple cultivars and seasons.
2. Forced budbreak for in-field inflorescence prediction
2.1. Vine-level predictive performance
Based on the number of buds retained after pruning and the average IFpot observed in the laboratory at each bud level, the expected number of inflorescences per vine was estimated and compared with field observations. Table 3 summarises the mean (± standard deviation) number of predicted and observed inflorescences per vine, the MAE, Bland–Altman bias with LOA and the equivalence outcomes from the TOST analysis (p = 0.05). For the Jaen variety, predicted and observed inflorescence numbers were practically identical in 2022/2023 (10.08 ± 4.38 vs 10.08 ± 4.93), with negligible bias and narrow LOA (0.00 ± 3.67). In 2023/2024, predicted values (9.89 ± 3.85) were slightly higher than those observed in the field (9.33 ± 4.17), resulting in a small positive bias (0.56 ± 4.28), while in 2024/2025 predicted and observed values again showed close agreement (4.65 ± 2.31 vs 4.53 ± 2.92; bias = 0.12 ± 3.31). For the Alfrocheiro variety in 2024/2025, predicted (10.60 ± 4.33) and observed (10.16 ± 4.33) values were close, although with a modest positive bias (0.45 ± 3.63). Across all seasons and varieties, predicted and observed inflorescences were statistically equivalent (p < 0.008) within the ±1 inflorescence margin according to the TOST evaluation, with MAE values ranging from 1.28 to 1.68 inflorescences per vine, indicating a generally low prediction error.
Season | Variety | n | Predicted inflo | Observed inflo | MAE | Bias ± LOA | Max TOST* |
|---|---|---|---|---|---|---|---|
2022/2023 | Jaen | 73 | 10.08±4.38 | 10.08±4.93 | 1.37 | 0.00 ± 3.67 | <0.001 |
2023/2024 | Jaen | 147 | 9.89±3.85 | 9.33±4.17 | 1.68 | 0.56 ± 4.28 | 0.008 |
2024/2025 | Jaen Alfrocheiro | 124 116 | 4.65±2.31 10.60±4.33 | 4.53±2.92 10.16±4.33 | 1.28 1.36 | 0.12 ± 3.31 0.45 ± 3.63 | <0.001 <0.001 |
* Equivalence threshold of ±1 inflorescence per vine.
Whilst laboratory forcing provides a relatively controlled and standardised approach to estimate bud fruitfulness, it cannot fully reproduce the complex environmental conditions experienced by vines in the field, such as seasonal temperature fluctuations, water availability, and biotic stresses. However, the associated prediction errors remained low, with MAE values consistently below two inflorescences per vine, and statistically demonstrated equivalence within ±1 inflorescence per vine. Although the 95 % limits of agreement (±3.31 to ±4.28) indicate wider individual vine-level variability, the near-zero bias values confirm the absence of systematic over- or underestimation, supporting the reliability of the method at the plot scale, where management decisions such as pruning intensity and crop load adjustment are made.
The Bland–Altman analysis showed minor seasonal fluctuations in bias and dispersion (Figure 5). Mean differences were close to zero in all cases, with no sign of persistent over- or underestimation in the forcing-based predictions. Most observations fell within the 95 % limits of agreement, confirming strong agreement between laboratory predictions and field measurements across the full range of inflorescence numbers. Agreement limits were somewhat wider in certain seasons, notably 2023/2024 for Jaen, which had the largest sample size and likely reflects both inter-annual environmental variability and a more complete representation of biological variation. These deviations were nonetheless modest and unlikely to compromise the practical usefulness of the predictions at plot level. Prediction error showed no clear trend with mean inflorescence number, indicating consistent performance across low and high fruitfulness levels and supporting the robustness of laboratory forcing as a predictive tool.
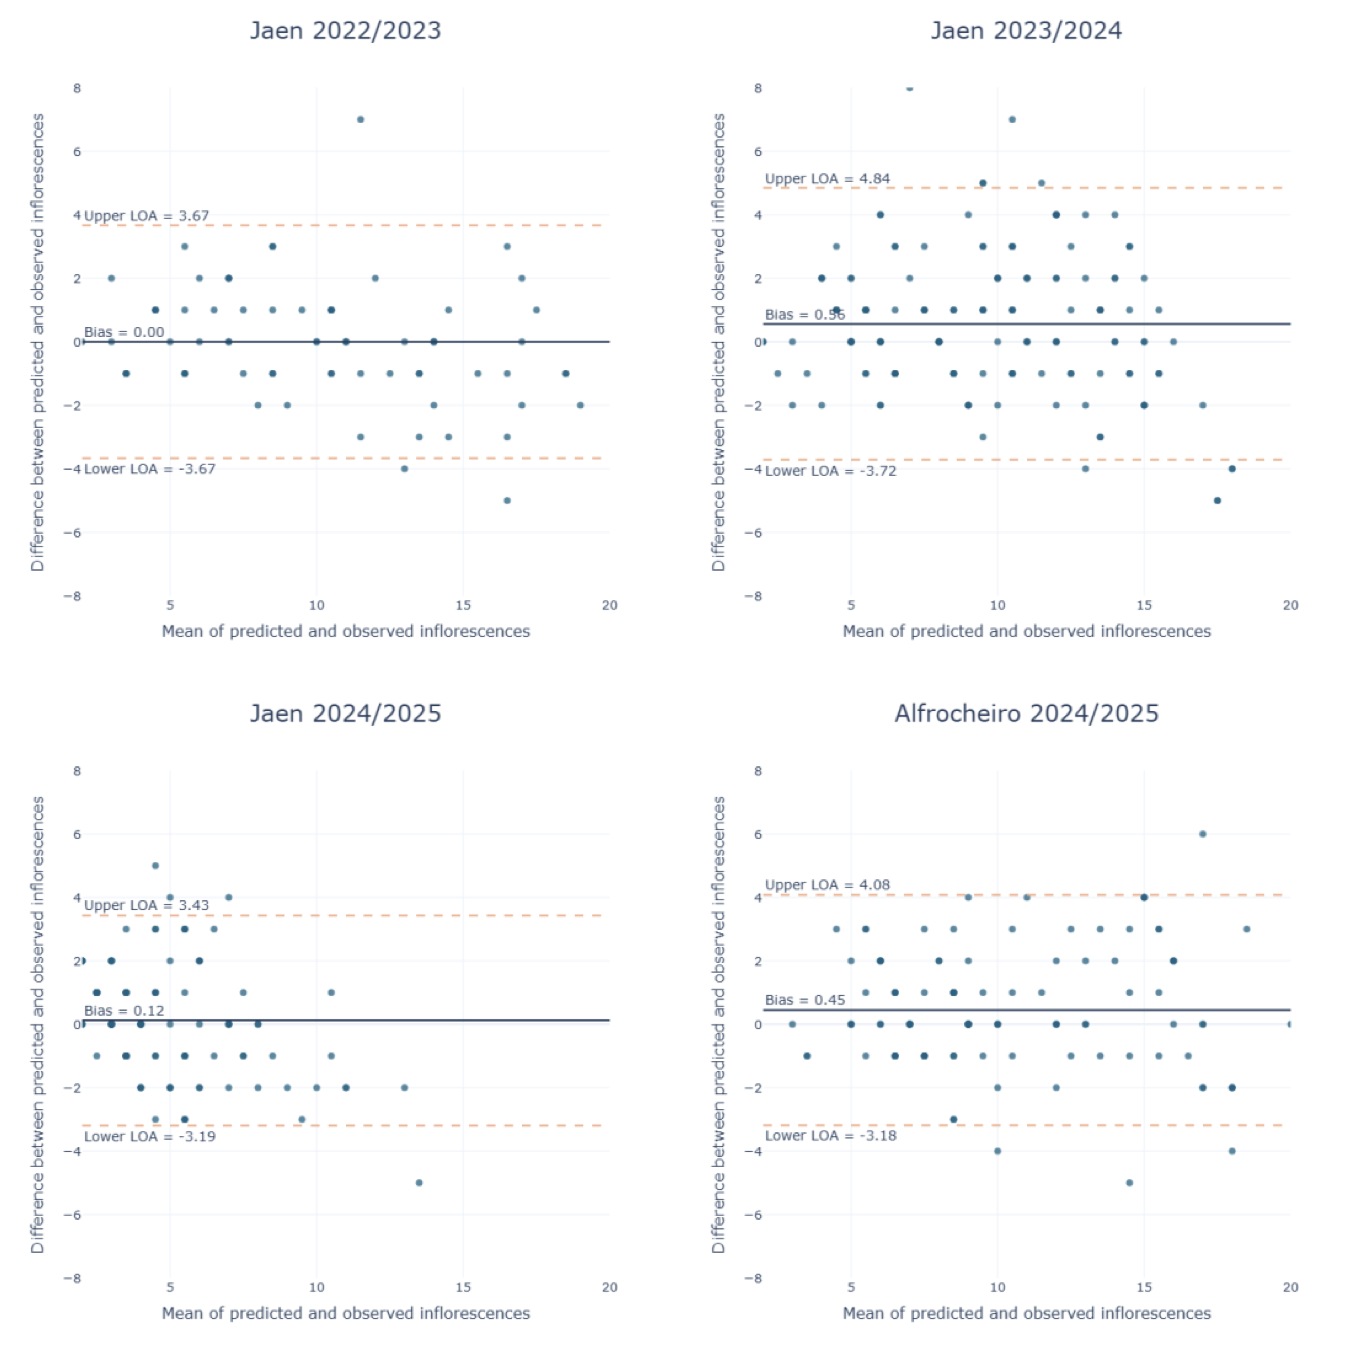
Figure 5. Bland–Altman plots showing the agreement between laboratory-predicted and field-observed inflorescences per vine for the Jaen and Alfrocheiro varieties in the 2022/2023, 2023/2024, and 2024/2025 seasons.
Consistent with the high level of agreement observed, the regression analyses revealed a strong linear relationship between predicted and observed inflorescence numbers across all seasons and varieties (Figure 6). 𝑅2 values ranged from 0.72 to 0.86, indicating that a substantial proportion of the variability in field fruitfulness was explained by the forcing-based predictions. The regression slopes were close to unity in all cases (0.91–1.06), and the intercepts were small (from −0.42 to +0.54), also suggesting an overall absence of strong systematic bias across the observed fruitfulness range.
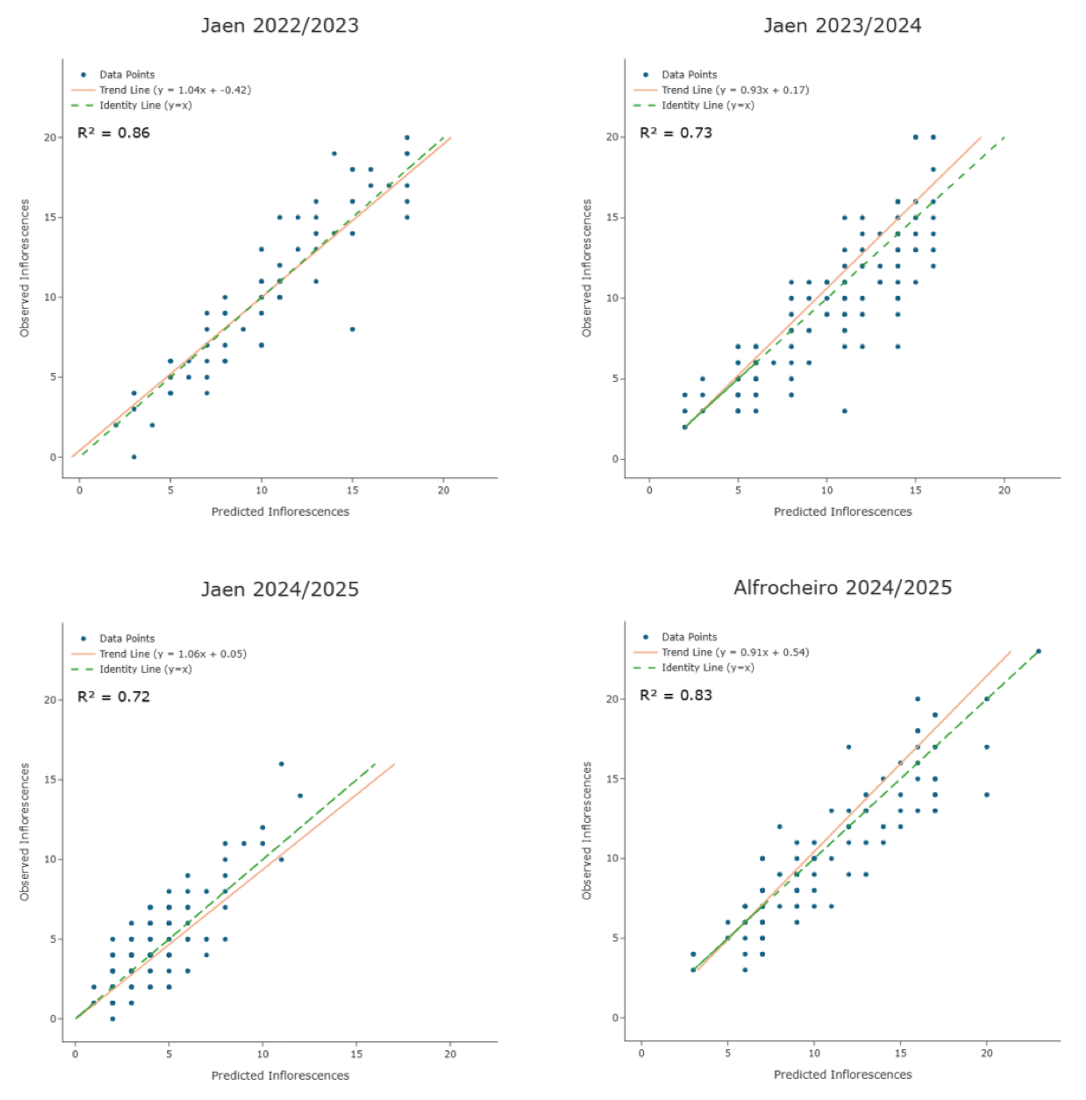
Figure 6. Relationship between predicted and observed numbers of inflorescences per vine for the Jaen and Alfrocheiro varieties in the 2022/2023, 2023/2024, and 2024/2025 seasons.
It is suggested by minor variations in model performance between seasons that environmental conditions and interannual variability in bud fruitfulness expression may influence the strength of the relationship between prediction and observation. Nevertheless, the near-unity slopes and small intercepts observed across all models indicate that the forcing budbreak method remains accurate even under low-fruitfulness conditions, such as those observed for the Jaen variety in the 2024/2025 season. The strong correlations and low absolute errors across all datasets indicate that these discrepancies are unlikely to have practical consequences for fruitfulness assessment. Furthermore, given that grapevine yield assessment is typically conducted at the plot or subplot scale, average fruitfulness values are more pertinent than individual vine-level precision. Consequently, the observed vine-to- vine variability does not compromise the utility of the forcing method for yield prediction, supporting its reliability and robustness for multi-year application.
2.2. Bud-level predictive performance
To better understand the biological basis of the previous results, a more detailed bud-level analysis was conducted. Stratifying buds by positional level (levels 1 and 2) enables the assessment of whether specific bud positions contribute disproportionately to the over- or underestimation of inflorescence number, while also clarifying the influence of seasonal variability on the fruitfulness expression within the vine structure.
For the Jaen variety (Figure 7) in 2023, predicted and observed mean inflorescence numbers were highly similar at both bud levels. At level 1, predicted fruitfulness (6.25 ± 1.47) slightly exceeded field observations (6.10 ± 2.24), while at level 2 the values were nearly identical (6.12 ± 2.12 predicted vs 6.27 ± 2.47 observed). In 2024, small divergences became more apparent, particularly at bud level 2, where the predicted number of inflorescences (6.18 ± 1.66) exceeded the observed field value (5.67 ± 2.06). At bud level 1, predicted (5.19 ± 1.56) and observed (5.05 ± 1.97) values remained closely aligned. Larger discrepancies were recorded in 2025. At bud level 1, laboratory predictions (4.17 ± 0.93) exceeded field observations (3.52 ± 1.76), whereas at bud level 2 the observed fruitfulness (3.47 ± 1.81) was slightly higher than the predicted value (3.20 ± 1.00). For the Alfrocheiro variety in 2025 (Figure 7), predicted and observed fruitfulness showed a strong correspondence at both bud levels. At level 1, predicted (6.24 ± 1.46) and observed (6.55 ± 2.00) values were very similar, while at level 2, predicted fruitfulness (8.28 ± 2.16) slightly exceeded the observed field value (7.51 ± 2.13).
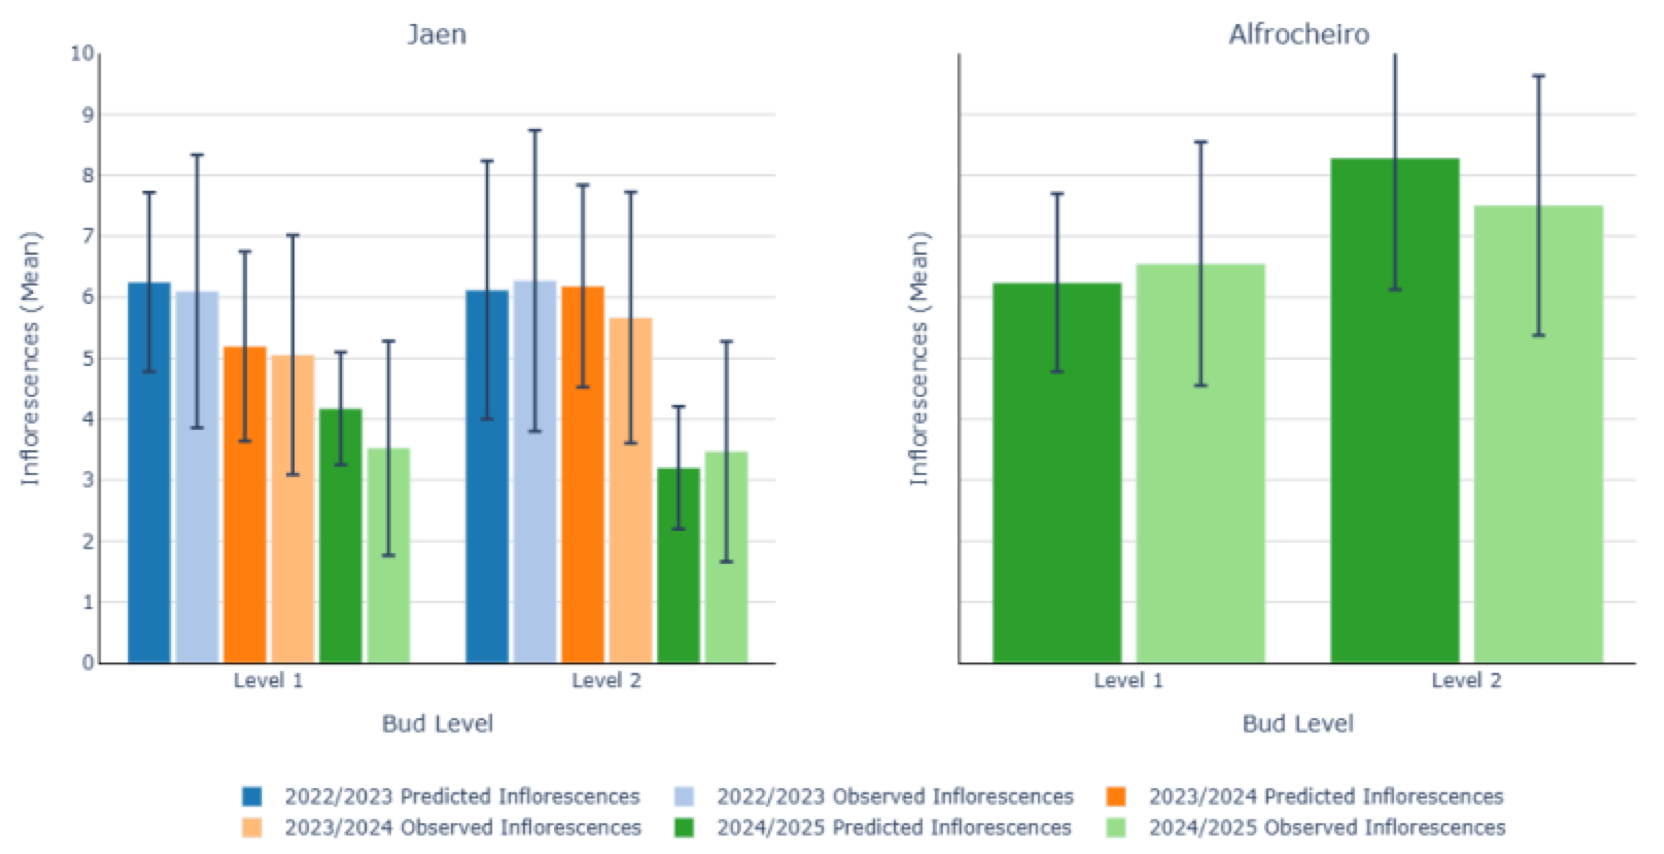
Figure 7. Comparison of predicted and observed mean fruitfulness in 2023, 2024, and 2025 between buds of different levels (level 1 and 2) of the Jaen and Alfrocheiro varieties.
Analysis of prediction errors at the bud level revealed that discrepancies between laboratory forcing and field observations were not uniformly distributed along the cane. Overall, in the Jaen variety, level-1 buds showed a small but consistent tendency toward overestimation of inflorescence number, whereas buds at level-2 were closer to unbiased predictions. In the 2023/2024 season, however, bud-position effects were more apparent. Level-1 buds showed only a slight overestimation, close to unbiased (Diff = +0.14), while level-2 buds overestimated inflorescence number more clearly (mean Diff = +0.52). In Alfrocheiro, the positional effect was stronger: level-1 buds were generally underestimated (mean Diff = −0.31) and level-2 buds markedly overestimated (mean Diff = +0.78).
Taken together, the vine- and bud-level analyses show that forced budbreak provides a robust and biologically reliable approach for estimating grapevine fruitfulness under field conditions. Predicted and observed inflorescence numbers were statistically equivalent within narrow margins, showed minimal systematic bias and low absolute errors, and were strongly linearly related across seasons and varieties. Bud-level assessments indicated that residual discrepancies arise mainly from minor positional effects along the cane and inter-annual fluctuations in fruitfulness expression, not from inherent limitations of the forcing approach. Despite localised directional biases at individual bud positions, roughly 72 % of predictions differed from field observations by no more than one inflorescence per vine, 90 % by no more than two, and 99 % by no more than three, keeping the absolute magnitude of errors low throughout. These small deviations did not compromise accuracy at vine or plot level, confirming the practical value of forced budbreak for fruitfulness evaluation and ultra-early yield prediction under variable environmental conditions.
3. Forced budbreak for in-field bunch and yield prediction
To assess whether the ultra-early prediction is retained until harvest, the predicted number of inflorescences per vine was compared with the number of bunches counted at harvest on the same vines. For the Jaen variety, predicted inflorescences and observed bunches were positively related in all three seasons (Table 4). In 2022/2023 the mean predicted value (12.67 ± 3.12) was slightly lower than the observed bunch number (14.09 ± 4.39), whereas in 2023/2024 (11.57 ± 2.86 vs 10.80 ± 4.32) and 2024/2025 (6.97 ± 2.02 vs 6.27 ± 3.18) the predicted values slightly exceeded the field counts. The MAE ranged from 2.15 to 2.76 bunches per vine, and the Bland–Altman analysis returned biases between −1.41 and 0.77 bunches per vine, with no clear trend between prediction error and mean bunch number.
Season | n | Predicted inflo | Observed bunches | Set ratio | MAE | Bias ± LOA | Max TOST* |
|---|---|---|---|---|---|---|---|
2022/2023 | 46 | 12.67±3.12 | 14.09±4.39 | 1.11 | 2.76 | -1.41 ± 6.44 | 0.116 |
2023/2024 | 109 | 11.57±2.86 | 10.80±4.32 | 0.93 | 2.72 | 0.77 ± 6.91 | <0.001 |
2024/2025 | 33 | 6.97±2.02 | 6.27±3.18 | 0.90 | 2.15 | 0.70 ± 5.06 | 0.003 |
* Equivalence threshold of ±2 bunches per vine.
Using an equivalence margin of ±2 bunches per vine, TOST analysis indicated that predicted inflorescence number and observed bunch number were statistically equivalent in 2023/2024 and 2024/2025. In 2022/2023, equivalence was not formally demonstrated because the 90 % confidence interval of the mean difference slightly exceeded the lower equivalence bound (–2.23), indicating a modest underestimation of final bunch number by the forcing-based prediction.
However, this attenuation is unlikely to be attributable solely to the budbreak forcing procedure. When bunch number was estimated from inflorescences counted directly in the field, rather than from laboratory-based predictions, the MAE decreased by less than one bunch per vine. The fact that exact field counts of inflorescences only marginally improved bunch-number prediction suggests that the additional dispersion arose mainly during the biological transition from inflorescence to bunch. This transition is influenced by processes such as fruit set, inflorescence abortion, and the emergence of additional fruitful shoots from secondary or tertiary buds, all of which would affect any inflorescence-based estimate of final bunch number, regardless of whether the initial inflorescence estimate was obtained in the laboratory or in the field. The excess of bunches over predicted inflorescences observed in 2022/2023 (set ratio = 1.11) may therefore be explained by the budbreak of secondary and tertiary buds, which produced additional fruitful shoots not accounted for by predictions based on the primary buds of the retained positions. In the two following seasons, harvested bunch number was lower than the predicted inflorescence number, reflecting a net loss of reproductive structures between flowering and fruit set.
Having established the relationship between forced-budbreak predictions and harvested bunch number, the final step was to evaluate how these predictions could be propagated to yield prediction through bunch weight (Table 5). To mimic an operational yield assessment scenario, predicted yield was calculated using a fixed inflorescence-to-bunch ratio of 0.98 and a fixed bunch weight of 128.92 g, corresponding to the mean values observed across the three seasons. Because no independent historical variety- and site-specific bunch-weight data were available, the pooled mean was used as a proxy for the historical value that would normally be applied in an operational setting. The same fixed value was applied to all seasons, thereby avoiding the direct use of each season’s specific harvest bunch weight.
Using this fixed mean bunch weight, predicted yields were 1.60, 1.46 and 0.88 kg/vine in 2022/2023, 2023/2024 and 2024/2025, respectively. These values were compared with observed yields of 2.30, 1.18 and 0.77 kg/vine. The corresponding prediction errors were −0.70, +0.28 and +0.11 kg/vine, indicating an underestimation of yield in 2022/2023 and slight overestimations in the two following seasons.
Season | Predicted inflo | Observed bunch weight (g) | Predicted yield (Kg/vine) | Observed yield (Kg/vine) | Error (Kg/vine) | |
|---|---|---|---|---|---|---|
2022/2023 | 12.67±3.12 | 163.77±41.84 | 1.60 ± 0.39 | 2.30±0.92 | −0.70 | |
2023/2024 | 11.57±2.86 | 105.53±30.04 | 1.46 ± 0.36 | 1.18±0.68 | +0.28 | |
2024/2025 | 6.97±2.02 | 117.46±52.23 | 0.88 ± 0.26 | 0.77±0.57 | +0.11 | |
Applying a fixed three-season mean bunch weight extended the forced-budbreak predictions from reproductive potential to yield, in the same way a historical variety and site-specific bunch-weight value would be used in practice. Exact per-season yields were not reproduced, but the seasonal decline in Jaen was captured, as predicted yield fell from 1.63 kg/vine in 2022/2023 to 0.90 kg/vine in 2024/2025. The forced budbreak method therefore provides the bunch-number component of the yield equation up to a full season before harvest, by delivering an early estimate of the inflorescences that translate into bunches at harvest. Bunch number is the component most strongly associated with seasonal yield variation in grapevine (Clingeleffer & Krstic, 2001), which makes this early information particularly relevant for management decisions taken before the inflorescences have emerged.
Residual differences between predicted and observed yield came mainly from seasonal variation in bunch weight. In 2022/2023, observed bunch weight exceeded the fixed mean and yield was underestimated. In 2023/2024 and 2024/2025, actual bunch weights fell below the fixed mean and yield was slightly overestimated. This points to a limit shared by any ultra-early prediction based on bud fruitfulness alone: once the number of reproductive structures is set, final yield accuracy depends on how well bunch weight is represented. Therefore, the error observed in the yield estimates should not be interpreted only as a limitation of the forced-budbreak method, but also as the consequence of using a simplified fixed bunch-weight assumption. The inclusion of additional yield components obtained at later stages of the growing season (e.g., cluster weight) may improve the quality of the predictions. However, because these indicators only become available very close to harvest, their use reduces the earliness of the model and, consequently, limits the practical utility of the predictions.
These results suggest that forced budbreak should be regarded as an ultra-early estimator of yield potential, not as a standalone predictor of final yield. Its main contribution is early information on the number of reproductive structures likely to be expressed in the field, available while management decisions such as pruning intensity and crop load adjustment can still be made. Turning this information into a final yield prediction requires a representative bunch weight component, which may come from historical records, seasonal field measurements, empirical or process-based models, weather-driven approaches, proximal or remote sensing data, or data-driven predictive models.
From a practical perspective, this approach provides a flexible prediction framework. At dormancy, forced budbreak can be used to estimate the reproductive potential of the vineyard. Later, as seasonal information becomes available, the initial estimate can be updated using improved bunch weight expectations or fruit-set observations. In this way, forced budbreak can serve as the first step in a sequential yield prediction system, linking early bud fruitfulness with later-season yield assessments. However, broader validation across additional seasons, varieties, training systems and environmental conditions will be necessary to determine how best to integrate several post-budbreak components and improve the operational accuracy of the full yield-prediction framework.
Conclusion
The forcing of dormant grapevine buds under controlled environmental conditions proved to be an effective and reliable method for the ultra-early assessment of vine fruitfulness and the prediction of inflorescence number months before harvest. Across three consecutive seasons (2022/2023 to 2024/2025) and two varieties (Jaen and Alfrocheiro), laboratory predictions agreed closely with field observations, with R² values between 0.72 and 0.86 and MAE below two inflorescences per vine in every case. Predicted and observed values were statistically equivalent within ±1 inflorescence per vine, confirming the robustness of the forcing technique under contrasting seasonal conditions and across different genetic backgrounds.
Bland–Altman analysis showed minimal systematic bias and narrow LOA across all seasons and varieties, with no sign of persistent over- or underestimation. At the bud level, roughly 72 % of predictions differed from field observations by no more than one inflorescence, sufficient accuracy for practical applications. The small intercept values and slopes close to unity in the regression models also indicate that the method remains reliable even for low-fruitfulness vines or seasons.
Beyond the inflorescence stage, predicted inflorescence numbers were positively related to the number of bunches counted at harvest in the Jaen variety, with R2 between 0.34 and 0.44. The additional dispersion did not originate primarily in the forcing procedure, but mainly during the biological transition between inflorescence emergence and harvest. As a proof of concept, applying a fixed inflorescence-to-bunch ratio and a fixed mean bunch weight, both averaged across the three seasons, to the predicted inflorescence number reproduced the direction of the between-season variation in yield in Jaen. Forced budbreak should therefore be regarded as an ultra-early estimator of the bunch number yield component, with a representative bunch weight component required to extend it to a full yield prediction framework.
Seasonal variability in model performance highlights the influence of environmental conditions on the expression of bud fruitfulness, while the contrasting responses of Jaen and Alfrocheiro in 2024/2025 suggest an additional influence of cultivar-specific traits. However, because Alfrocheiro was evaluated in only one season, possible genotype × environment interactions could not be formally assessed. Nevertheless, the consistent linear relationship between predicted and observed inflorescence numbers supports the general applicability of the forcing-based approach. The observed vine-to-vine variability does not compromise the usefulness of the method for yield prediction at the scale relevant to vineyard management, and by providing reliable, early estimates of fruitfulness, this technique offers valuable support for strategic decisions such as winter pruning intensity, crop load adjustment, and resource planning.
Future research should expand the evaluation of forced budbreak to include more distal bud positions, additional cultivars, training systems, seasons, and growing environments. Evaluating multiple cultivars across the same seasons and sites would allow cultivar-specific responses and genotype × environment interactions to be formally assessed. Integrating this approach with emerging technologies such as Artificial Intelligence and multispectral imaging could enhance automation, spatial resolution, and predictive accuracy. Such developments would strengthen the role of bud forcing as a practical, scalable tool for early-season decision-making in viticulture under increasingly variable climatic conditions.
Acknowledgements
This work was co-financed by "Component 5: Capitalization and Business Innovation", integrated in the Resilience Dimension of the Recovery and Resilience Plan within the scope of the Recovery and Resilience Mechanism (MRR) of the European Union (EU), framed in the NextGenerationEU, for the period 2021–2026 within the project “Wine4cast – Space-time prediction of wine productivity for multi-actor usability: integration of remote optical-photonic sensors, artificial intelligence and climate scenarios” [grant number PRR-C05-i03-I-000071] https://www.fc.up.pt/Wine4Cast/Home.html
The authors would like to acknowledge the scholarship number “2022.09726.BD”, funded by National Funds through the Portuguese funding agency, FCT (Fundação para a Ciência e Tecnologia). The authors would like to thank the Dão Wine Studies Centre (CEVD), Center Regional Coordination and Development Commission (CCDRC), Nelas Innovation Hub, for the contribution in all the experimental trials conducted.
References
- Anzanello, R., Fialho, F., & Pessoa dos Santos, H. (2018). Chilling requirements and dormancy evolution in grapevine buds. Ciência e Agrotecnologia, 42, 364-371. https://doi.org/10.1590/1413-70542018424014618
- Arora, R., Rowland, L., & Tanino, K. (1953). Induction and Release of Bud Dormancy in Woody Perennials: A Science Comes of Age. HortScience, 38, 911-921. https://doi.org/10.21273/HORTSCI.38.5.911
- Böhm, J. (2007). O grande livro das castas. Chaves Ferreira Publicações, 110-111.
- Boss, P., Buckeridge, E., Poole, A., & Thomas, M. (2003). New insights into grapevine flowering. Functional Plant Biology, 30, 593-606. https://doi.org/10.1071/FP02112
- Buttrose, M. (1969). Fruitfulness in grapevines: effects of changes in temperature and light regimes. Botanical Gazette, 130(3), 173-179
- Buttrose, M. (1970). Eruitfulness in grape-vines: the response of different culti-vars to light, temperature and daylength.
- Buttrose, M. (1974). Fruitfulness in grape-vines: effects of water stress.
- Carmona, M. J., Chaïb, J., Martínez-Zapater, J. M., & Thomas, M. R. (2008). A molecular genetic perspective of reproductive development in grapevine. Journal of Experimental Botany, 59(10), 2579-2596. https://doi.org/10.1093/jxb/ern160
- Champagnol, F. (1984). Elements de physiologie de la vigne et de viticulture generale. https://hal.inrae.fr/hal-02857709
- Clingeleffer, P. R., & Krstic, M. (2001). Crop development, crop estimation and crop control to secure quality and production of major wine grape varieties: a national approach: final report to Grape and Wine Research & Development Corporation. Grape and Wine Research & Development Corporation.
- Cunha, M., Abreu, I., Pinto, P., & de Castro, R. (2003). Airborne Pollen Samples for Early-Season Estimates of Wine Production in a Mediterranean Climate Area of Northern Portugal. American Journal of Enology and Viticulture, 54(3), 189-194. https://doi.org/10.5344/ajev.2003.54.3.189
- Cunha, M., Marçal, A. R. S., & Silva, L. (2010). Very early prediction of wine yield based on satellite data from VEGETATION. International Journal of Remote Sensing, 31(12), 3125-3142. https://doi.org/10.1080/01431160903154382
- Cunha, M., Ribeiro, H., & Abreu, I. (2016). Pollen-based predictive modelling of wine production: application to an arid region. European Journal of Agronomy, 73, 42-54. https://doi.org/https://doi.org/10.1016/j.eja.2015.10.008
- Faust, M., Erez, A., Rowland, L. J., Wang, S. Y., & Norman, H. A. (1997). Bud Dormancy in Perennial Fruit Trees: Physiological Basis for Dormancy Induction, Maintenance, and Release. HortScience, 32, 623-629. https://doi.org/10.21273/HORTSCI.32.4.623
- Food Agriculture Organization of the United Nations. (1998). World Reference Base for Soil Resources. Food & Agriculture Organization of the United Nations (FAO).
- Guilpart, N., Metay, A., & Gary, C. (2014). Grapevine bud fertility and number of berries per bunch are determined by water and nitrogen stress around flowering in the previous year. European Journal of Agronomy, 54, 9-20. https://doi.org/https://doi.org/10.1016/j.eja.2013.11.002
- IPMA. (2023a). Winter 2022-2023 Climate Summary for Mainland Portugal. https://www.ipma.pt/pt/publicacoes/boletins.jsp
- IPMA. (2023b). Winter 2023-2024 Climate Summary for Mainland Portugal. https://www.ipma.pt/pt/publicacoes/boletins.jsp
- Keller, M., Mills, L. J., Wample, R. L., & Spayd, S. E. (2005). Cluster thinning effects on three deficit-irrigated Vitis vinifera cultivars. American Journal of Enology and Viticulture, 56(2), 91-103.
- Khanduja, S. D., & Abbas, S. (2017). Estimating fruitfulness of grape-vine buds by forced bursting in summer in the tropics of India. VITIS - Journal of Grapevine Research, 12(1), 23. https://doi.org/10.5073/vitis.1973.12.23-25
- Kovaleski, A. P., Londo, J. P., & Finkelstein, K. D. (2019). X-ray phase contrast imaging of Vitis spp. buds shows freezing pattern and correlation between volume and cold hardiness. Scientific Reports, 9(1), 14949. https://doi.org/10.1038/s41598-019-51415-2
- Laurent, C., Oger, B., Taylor, J. A., Scholasch, T., Metay, A., & Tisseyre, B. (2021). A review of the issues, methods and perspectives for yield estimation, prediction and forecasting in viticulture. European Journal of Agronomy, 130, 126339. https://doi.org/https://doi.org/10.1016/j.eja.2021.126339
- Lebon, G., Wojnarowiez, G., Holzapfel, B., Fontaine, F., Vaillant-Gaveau, N., & Clément, C. (2008). Sugars and flowering in the grapevine (Vitis vinifera L.). Journal of Experimental Botany, 59(10), 2565-2578. https://doi.org/10.1093/jxb/ern135
- Magalhães, N. P. d. C. (2015). Tratado de viticultura: a videira, a vinha e o "terroir" (2ª rev. e act. ed.). Esfera Poética.
- Martínez de Toda, F. (1991). Biología de la vid. Fundamentos biológicos de la viticultura.
- Matese, A., & Di Gennaro, S. (2015). Technology in precision viticulture: A state of the art review. International Journal of Wine Research, 7. https://doi.org/10.2147/IJWR.S69405
- May, P. (1961). The value of an estimate of fruiting potential in the Sultana. VITIS - Journal of Grapevine Research, 3(1), 15. https://doi.org/10.5073/vitis.1961.3.15-26
- May, P., & Antcliffe, A. (1973). The fruitfulness of grape buds. I. Measuring bud fruitfulness on forced single-node cuttings.
- May, P. T. (2000). From bud to berry, with special reference to inflorescence and bunch morphology in Vitis vinifera L. Australian Journal of Grape and Wine Research, 6, 82-98.
- Monteiro, A. I., Ferreira, H., Ferreira-Cardoso, J. V., Malheiro, A. C., & Bacelar, E. A. (2022). Assessment of bud fruitfulness of three grapevine varieties grown in northwest Portugal. OENO One, 56(3), 385-395. https://doi.org/10.20870/oeno-one.2022.56.3.5363
- Monteiro, A. I., Malheiro, A. C., & Bacelar, E. A. (2021). Morphology, Physiology and Analysis Techniques of Grapevine Bud Fruitfulness: A Review. Agriculture, 11(2), 127. https://www.mdpi.com/2077-0472/11/2/127
- Noyce, P. W. (2017). Finally, proof that leaf floral induction with photoperiodic dependent flowering does not occur in the grapevine plant (Vitis vinifera L. 'Chardonnay'). VITIS - Journal of Grapevine Research, 56(3), 119-126. https://doi.org/10.5073/vitis.2017.56.119-126
- Nuske, S., Wilshusen, K., Achar, S., Yoder, L., Narasimhan, S., & Singh, S. (2014). Automated Visual Yield Estimation in Vineyards. Journal of Field Robotics, 31(5), 837-860. https://doi.org/https://doi.org/10.1002/rob.21541
- Pellegrino, A., Rogiers, S., & Deloire, A. (2020). Grapevine Latent Bud Dormancy and Shoot Development. IVES Technical Reviews, vine and wine. https://doi.org/10.20870/IVES-TR.2020.3420
- Pratt, C. (1971). Reproductive Anatomy in Cultivated Grapes - A Review. American Journal of Enology and Viticulture.
- Ramos, A. M. S. (1991). Contributo para o estudo dos hábitos de frutificação da videira (Vitis vinifera L.): castas regionais da Beira Interior Instituto Politecnico de Castelo Branco (Portugal)].
- Ravaz, L. (1912). L'effeuillage de la vigne. Coulet & fils. https://books.google.pt/books?id=mRAxMgEACAAJ
- Ridley, W., Luckstead, J., & Devadoss, S. (2022). Wine: The punching bag in trade retaliation. Food Policy, 109, 102250. https://doi.org/https://doi.org/10.1016/j.foodpol.2022.102250
- Ritter, E. J., Cousins, P., Quigley, M., Kile, A., Kenchanmane Raju, S. K., Chitwood, D. H., & Niederhuth, C. (2024). From buds to shoots: insights into grapevine development from the Witch’s Broom bud sport. BMC Plant Biology, 24(1), 283. https://doi.org/10.1186/s12870-024-04992-y
- Rodrigues, P., Pedroso, V., Gouveia, J. P., Martins, S., Lopes, C., & Alves, I. (2012). Influence of soil water content and atmospheric conditions on leaf water potential in cv. “Touriga Nacional” deep-rooted vineyards. Irrigation Science, 30(5), 407-417. https://doi.org/10.1007/s00271-012-0350-4
- Santos, M., Fonseca, A., Fraga, H., Jones, G. V., & Santos, J. A. (2020). Bioclimatic conditions of the Portuguese wine denominations of origin under changing climates. International Journal of Climatology, 40(2), 927-941. https://doi.org/https://doi.org/10.1002/joc.6248
- Signorelli, S., Shaw, J., Hermawaty, D., Wang, Z., Verboven, P., Considine, J. A., & Considine, M. J. (2019). The initiation of bud burst in grapevine features dynamic regulation of the apoplastic pore size. Journal of Experimental Botany, 71(2), 719-729. https://doi.org/10.1093/jxb/erz200
- Srinivasan, C., & Mullins, M. G. (1980). Effects of Temperature and Growth Regulators on Formation of Anlagen, Tendrils and Inflorescences in Vitis vinifera L. Annals of Botany, 45(4), 439-446. https://doi.org/10.1093/oxfordjournals.aob.a085842
- Tardaguila, J., Blanco, J. A., Poni, S., & Diago, M. P. (2012). Mechanical yield regulation in winegrapes: comparison of early defoliation and crop thinning. Australian Journal of Grape and Wine Research, 18(3), 344-352. https://doi.org/https://doi.org/10.1111/j.1755-0238.2012.00197.x
- Torregrosa, L., Carbonneau, A., & Kelner, J.-J. (2021). The shoot system architecture of Vitis vinifera ssp. sativa. Scientia Horticulturae, 288, 110404. https://doi.org/https://doi.org/10.1016/j.scienta.2021.110404
- Vasconcelos, M. C., Greven, M., Winefield, C. S., Trought, M. C. T., & Raw, V. (2009). The Flowering Process of Vitis vinifera: A Review. American Journal of Enology and Viticulture, 60(4), 411-434. https://doi.org/10.5344/ajev.2009.60.4.411
 Views: 407
 XML: 26