

VITICULTURE / Original research article
Abstract
The ripening of fleshy fruits is characterised by extensive metabolic reprogramming, with substantial alterations in sugar and acid metabolism, hormonal signalling, and cell wall remodelling. Such intensified metabolic activities enhance respiratory and redox reactions, from which reactive oxygen species (ROS) are generated as by-products of aerobic metabolism. While excessive ROS can disrupt proteins, lipids, and nucleic acids, ROS signalling appears to function as a central regulator of developmental transitions during fruit ripening. In this study, we integrated quantitative proteomics and enzymatic profiling to investigate redox metabolism during key developmental stages of berry ripening in the table grape cultivar Vitis labrusca × Vitis vinifera cv. Niagara Rosada. We hypothesised that dynamic regulation of ROS-scavenging enzymes and NADPH-generating pathways limits oxidative injury and supports mesocarp functionality despite the enhanced metabolic activity associated with ripening. Among 1,434 identified proteins, 956 (67 %) were differentially accumulated. Functional enrichment revealed that antioxidant processes were predominant, but the dataset also encompassed proteins from energy metabolism, hormone metabolism, protein turnover, secondary metabolism, and stress-response categories. Distinct accumulation patterns were observed: photosynthetic and energy-related proteins predominated at early stages, whereas antioxidant and stress-related proteins accumulated later, suggesting stage-dependent reprogramming of the proteome. Integration with enzymatic assays reinforced this dynamic, as catalase followed a biphasic profile, superoxide dismutase peaked at late ripening, and peroxidase activity declined progressively. Glutathione reductase and glutathione peroxidase displayed stage-dependent regulation, underscoring the importance of NADPH-dependent detoxification pathways. Despite enhanced ROS-associated activity, Pi leakage and lipid peroxidation suggested moderate membrane-associated oxidative changes rather than extensive cellular deterioration. Together, these findings suggest that grape berries deploy a coordinated antioxidant network that adjusts proteome composition and enzymatic defences to balance ROS generation and detoxification. Stage-dependent redox regulation emerges as a central feature of berry development, supporting mesocarp functionality and fruit quality. By integrating proteomic and enzymatic evidence, this study establishes a comprehensive framework of redox metabolism during grape berry ripening.
Introduction
The ripening of fleshy fruits is a highly coordinated developmental process that integrates physiological, biochemical, and structural modifications that determine organoleptic quality and post-harvest stability. It involves a progressive accumulation of sugars, which modifies taste and osmotic balance, decline in organic acids that affects flavour and acidity, and profound changes in hormonal signalling pathways that regulate the transition from growth to maturation. Additional features include the synthesis of volatile and aromatic compounds that define fruit aroma, the breakdown of chlorophyll, and cell wall remodelling, which confers texture and softness (Giovannoni et al., 2017). Together, these events confer the specific quality traits that distinguish ripe fruits, but they also expose tissues to greater metabolic demands and vulnerability to oxidative stress.
Reactive oxygen species (ROS) are continuously produced as by-products of aerobic metabolism, making their presence unavoidable during fruit development. Mitochondria are major contributors, as electron leakage from complexes I and III of the respiratory chain leads to superoxide formation. However, other compartments, including chloroplasts, the apoplast and the endoplasmic reticulum, are also important sources of ROS in developing plant tissues (Møller, 2001; Neill, 2002; Veal et al., 2007; Birk et al., 2013). In addition to organellar metabolism, a range of enzymes catalyse ROS production: NADPH oxidases at the plasma membrane, cell wall peroxidases, xanthine oxidase and amine oxidase, among others (Corpas et al., 2001; Bolwell, 2002; Torres et al., 2002; Bindschedler et al., 2006; Suzuki et al., 2011). The resulting ROS species include singlet oxygen (1O2), superoxide anion (O2•–), hydroxyl radicals (•OH), and hydrogen peroxide (H2O2). Each of these has distinct chemical properties: hydroxyl radicals are highly reactive and short-lived, causing immediate oxidative damage, whereas H2O2 is more stable, freely diffusible, and capable of acting as a versatile signalling intermediate. This duality illustrates the paradoxical role of ROS in plant physiology: moderate accumulation functions as an essential signal in development and adaptive responses, whereas excessive ROS generation promotes oxidation of proteins, lipids, and nucleic acids, leading to structural and functional impairment (Imlay, 2003; Ogilby, 2010).
To mitigate this intrinsic risk, plants employ a highly sophisticated antioxidant defence network that ensures redox homeostasis. This network integrates small-molecule antioxidants, such as ascorbate, glutathione, polyphenols and carotenoids, with an extensive set of antioxidant enzymes. Key enzymatic components include superoxide dismutase (SOD), which catalyses the dismutation of superoxide to H2O2 and O2; catalase (CAT), which detoxifies H2O2 at high concentrations; ascorbate peroxidase (APX), with high affinity for H2O2 under basal conditions; and glutathione peroxidase (GPX), glutathione reductase (GR) and peroxiredoxins (Prx), which contribute to finely tuned ROS scavenging throughout different cellular compartments. The operation of this system depends on a continuous supply of reducing power, especially NADPH. The regeneration of glutathione and thioredoxin pools, which are essential for GPX and Prx activity, relies on NADPH-dependent enzymes such as glucose-6-phosphate dehydrogenase (G6PDH), 6-phosphogluconate dehydrogenase (6PGDH) and isocitrate dehydrogenase (ICDH) (Foyer et al., 1997; Jimenez et al., 1997; Corpas et al., 1998; Corpas et al., 1999; Arnér & Holmgren, 2000; Rhee & Woo, 2011; Halliwell & Gutteridge, 2015). Thus, the integration of ROS generation and detoxification constitute a dynamic equilibrium, critical for cell survival and developmental regulation.
Berry ripening represents a particularly relevant developmental context in which redox equilibrium must be preserved. Enhanced metabolic activity, including intensified respiration, sugar accumulation and hormonal reprogramming, inevitably enhances ROS generation during the transition from growth to maturation (Zeng et al., 2010). Controlled ROS accumulation has been associated with the onset of berry ripening, indicating that oxidative events may participate in developmental regulation rather than merely reflect metabolic disorder (Pilati et al., 2014). Nonetheless, despite elevated ROS contents during post-veraison, many fleshy fruits retain metabolic coordination and tissue functionality, avoiding premature cell death (Chan et al., 2016). This observation suggests that antioxidant defences are not only active but dynamically modulated throughout ripening to ensure viability. Understanding how berries orchestrate this balance between oxidative metabolism and antioxidant capacity is therefore essential in order to unravel the molecular bases of development and quality maintenance.
Grape berries constitute a suitable system for addressing this question. As non-climacteric fruits, grape berries ripen through finely coordinated interactions between sugar accumulation, hormonal regulation, and redox-related signalling rather than through a primarily ethylene-driven programme (Giovannoni et al., 2017; Lu et al., 2024; Pilati et al., 2014). Previous studies have provided valuable insights into transcriptional regulation and enzymatic activities associated with antioxidant responses in grapevine. For example, alterations in catalase or superoxide dismutase activity have been reported in association with developmental stages or stress exposure (Wang et al., 2019). However, although controlled ROS accumulation has been described at the onset of ripening, these approaches have generally focused on skin tissues, individual enzymes, or transcript-level responses (Pilati et al., 2014). They therefore provide only an incomplete framework for understanding the coordinated redox adjustments occurring in the mesocarp, where tissue functionality and fruit texture must be preserved throughout maturation, particularly because transcript abundance does not necessarily correspond to protein accumulation or catalytic activity. A more comprehensive interpretation requires the integration of proteomic datasets with enzymatic activity profiles, capturing both abundance and functional capacity of redox-related pathways.
In this study, we employed quantitative proteomic profiling combined with enzymatic assays to characterise the dynamics of redox metabolism during the ripening of Vitis labrusca × Vitis vinifera cv. Niagara Rosada. This cultivar is an economically important hybrid widely cultivated in Brazil, providing a relevant model for understanding the ripening physiology of table grapes grown in warm regions. By examining three key developmental stages, we aimed to identify proteins and enzymatic responses directly or indirectly associated with ROS metabolism. We hypothesised that stage-specific regulation of antioxidant enzymes and NADPH-generating pathways contributes to the control of oxidative processes in the mesocarp, supporting tissue functionality despite enhanced ROS-associated metabolism during ripening.
Materials and methods
1. Plant Material and berry qualitative traits
Berries of Vitis labrusca × Vitis vinifera cv. Niagara Rosada, a somatic mutation of cv. Niagara (VIVC 8540; Pierozzi & Moura, 2014), grafted onto IAC-572 rootstock, were used in this study. The vineyard was established in 2006 in the municipality of São Fidélis, Rio de Janeiro, Brazil (21°31′ S, 41°42′ W) and trained on a pergola system with spacing of 2.5 m × 2.0 m. Plants were drip irrigated using two emitters per plant positioned 0.5 m from the stem on opposite sides.
Two grape growing cycles were evaluated: October to December 2022 for proteomic analysis, and another from February to June 2023 for enzymatic activity assays. Sampling was carried out according to the modified E-L system (Coombe, 1995) at four developmental stages: EL 33: berries still hard and green (pre-veraison); EL 35: berries begin to colour and enlarge (veraison); EL 39: berries over-ripe; and EL 41: post-harvest with complete maturation of shoots. Stage EL 41 was used exclusively for enzymatic activity assays.
At each developmental stage, three biological replicates were used for proteomic analysis. Each replicate comprised pooled mesocarp tissue from five berries, each sampled from a distinct group of bunches. Skins and seeds were removed immediately after sampling, and the mesocarp wrapped in aluminium foil, frozen in liquid nitrogen, and transported to the laboratory (located 71 km away from the vineyard). Samples were stored at −80 °C until analysis. Fresh bunches intended for berry quality assessments and physiological and biochemical assays were transported separately in plastic bags inside an ice-cooled Styrofoam box.
At the laboratory, five fresh berries were randomly selected from each sampled bunch for qualitative analysis. The equatorial diameter of individual berries was measured with a digital calliper (Digimess, Brazil). Firmness was determined using a texture analyser (TA-XT, Stable Micro Systems, UK) equipped with a stainless-steel plate.
Mesocarp juice was extracted from individual berries for biochemical analyses. Total soluble solids (TSS) were measured with a temperature-compensated refractometer (RHB-32/ATC, Yhequipment, China) and expressed in °Brix. Titratable acidity (TA) was determined by titration of berry pulp homogenates with 0.1 N sodium hydroxide (NaOH) to pH 8.2 using phenolphthalein as indicator, with results expressed as grams of tartaric acid per 100 mL of juice.
2. Physiological and biochemical assays
2.1. Inorganic phosphate (Pi)
Inorganic phosphate was quantified in fresh berries using a modified colourimetric method of Fiske and Subbarow, (1925). Berry mesocarp tissue (1 g) was homogenised in 2 mL of ice-cold 0.1 % (w/v) trichloroacetic acid (TCA) containing 0.1 % (w/v) PVPP and centrifuged at 10,000 × g for 10 min at 4 °C. Supernatants (500 µL) were mixed with 500 µL of 5 % TCA and 1 mL of freshly prepared staining solution, consisting of 0.5 % (w/v) SDS, 0.5 % (w/v) ammonium molybdate and 2 % (v/v) sulphuric acid (H2SO4) combined with 0.5 % (w/v) ascorbic acid. After incubation for 10 min at room temperature, absorbance was measured at 750 nm with a UV–Vis spectrophotometer (Cary 50, Varian, USA). Pi concentration was determined using a KH2PO4 standard curve and expressed as µmol g–1 fresh mass.
2.2. Lipid peroxidation
Lipid peroxidation was determined in fresh berries by quantifying thiobarbituric acid reactive substances (TBARS), using malondialdehyde (MDA) as a standard (Heath & Packer, 1968; Buege & Aust, 1978; Dhindsa et al., 1981). Berry mesocarp tissue (1 g) was homogenised in 2 mL of 0.1 % (w/v) trichloroacetic acid (TCA) containing 0.1 % (w/v) polyvinylpolypyrrolidone (PVPP). The homogenate was centrifuged at 10,000 × g for 10 min at 4 °C, and the supernatant collected. Aliquots (1 mL) were mixed with 2 mL of TCA–TBA reagent (15 % TCA, 0.5 % thiobarbituric acid), incubated at 95 °C for 30 min, and immediately cooled on ice. Samples were centrifuged again under the same conditions, and absorbance of the supernatant was measured at 535 nm using a UV–Vis spectrophotometer (Cary 50, Varian, USA). MDA concentration was calculated with ε = 155 mM−1 cm−1 and expressed as nmol mL−1.
2.3. Protein quantification and enzymatic activities
Enzyme extracts were prepared from 1 g of fresh deseeded mesocarp homogenised in 1.5 mL of extraction buffer specific for each assay. Homogenates were centrifuged at 10,000 × g for 10 min at 4 °C, and the supernatants were used immediately. Protein concentration was estimated using a Pierce Coomassie (Bradford) protein assay kit (Thermo Fisher Scientific, USA) in a 96-well microplate (Cralplast, Brazil) and the absorbance was measured at 595 nm with a microplate reader (μ-Quant, Bio-Tek Instruments, UK). KCJunior software (Bio-Tek Instruments, UK) was used to calculate the protein concentration, and used to normalise activities, which were expressed as specific activity (units per mg protein). All steps were performed on ice.
Catalase (CAT, EC 1.11.1.6) activity was measured as the decrease in absorbance at 240 nm in 50 mM phosphate buffer (pH 7.0) containing 10 mM hydrogen peroxide (H2O2), as modified from Sinha, 1972. One unit (U) was defined as a ΔA240 of 0.001 min–1 mg–1 protein.
Glucose-6-phosphate dehydrogenase (G6PDH, EC 1.1.1.49) activity was determined following Wang et al. (2019), by monitoring nicotinamide adenine dinucleotide phosphate (oxidised form; NADP+) reduction to nicotinamide adenine dinucleotide phosphate (reduced form; NADPH) at 340 nm in 55 mM tris(hydroxymethyl)aminomethane–hydrochloric acid (Tris–HCl) buffer (pH 7.8), containing 3 mM magnesium chloride (MgCl2), 10 mM glucose-6-phosphate and 0.6 mM NADP+. Results were expressed as mU mg–1 protein.
Superoxide dismutase (SOD, EC 1.15.1.1) activity was assayed by inhibition of nitroblue tetrazolium (NBT) photoreduction at 560 nm (Rao et al., 1996). One unit corresponded to 50 % inhibition of NBT reduction. Results were expressed as U mg–1 protein.
Ascorbate peroxidase (APX, EC 1.11.1.11) activity was monitored as the decrease in absorbance at 265 nm due to oxidation of 0.5 mM ascorbate in 50 mM potassium phosphate buffer (pH 7.5) containing 1 mM H2O2, according to Barka, (2001). Calculations used ε = 14 mM⁻1 cm⁻1.
Peroxidase (PX, EC 1.11.1.7) activity was determined by pyrogallol oxidation at 430 nm in 0.05 M phosphate buffer (pH 7.0) containing 1% H2O2 (Addy & Goodman, 1973; Rani et al., 2004). Results were calculated using ε = 2.47 mM⁻1 cm⁻1.
Glutathione peroxidase (GPX, EC 1.11.1.9) activity was determined in 0.4 M phosphate buffer (pH 7.4) containing 1 mM reduced glutathione, 2.5 mM H2O2 and 10 mM sodium azide (NaN3), according to Rotruck et al. 1973. Reactions were stopped using 10% TCA, the supernatant was mixed with 5,5′-dithiobis(2-nitrobenzoic acid) (DTNB) reagent, and absorbance was read at 412 nm. Activity was expressed as mg glutathione oxidised mg⁻1 protein.
Glutathione reductase (GR, EC 1.6.4.2) activity was assayed by NADPH oxidation at 340 nm in phosphate buffer (pH 7.5) containing 1 mM oxidised glutathione (GSSG). Results were expressed as mU mg⁻1 protein.
3. Proteomic analysis
3.1. Protein extraction
Three biological replicates from frozen samples were mechanically macerated in liquid nitrogen to a fine powder. 500 mg fresh mass (FM) of berry mesocarp were collected from each replicate and transferred to 1.5 mL microtubes. Protein extraction was performed using a modified urea/thiourea method as described by Reis et al. (2021). Briefly, the macerated samples were resuspended in 1 mL of ice-cold extraction buffer containing 7 M urea (Cytiva, Marlborough, MA, USA), 2 M thiourea (Cytiva), 2 % (v/v) Triton X-100 (Cytiva), 1 % (w/v) dithiothreitol (DTT; Bio-Rad Laboratories, USA), and 1 mM phenylmethylsulfonyl fluoride (PMSF; Sigma-Aldrich, USA). The suspension was vortexed for 30 min at 8 °C, incubated at −20 °C for 1 h, and centrifuged at 16,000 × g for 30 min at 4 °C. The resulting pellets were washed three times with cold acetone containing 20 mM DTT and centrifuged at 16,000 × g for 5 min per wash. After air-drying, pellets were resuspended, vortexed again for 30 min at 4 °C, and centrifuged at 16,000 × g for 20 min. The supernatants were collected, and protein concentrations were determined using the 2-D Quant Kit (Cytiva).
3.2. Protein digestion
Aliquots containing 100 μg of protein per sample were first precipitated using a methanol/chloroform protocol (Nanjo et al., 2012) to remove contaminants. Proteins were then digested by the filter-aided sample preparation (FASP) method according to Da Paschoa et al., (2026), with Microcon-30 kDa centrifugal filters (Merck Millipore, USA). Digestion was performed at a 1:100 (w/w) trypsin-to-protein ratio (V5111; Promega, USA). The resulting peptides were vacuum-dried and reconstituted at a concentration of 0.7 μg μL–1 in a solution containing 95 % water (Tedia, Fairfield, Ohio, USA), 5 % acetonitrile (Sigma-Aldrich), and 0.1 % formic acid (Sigma-Aldrich) for mass spectrometry (MS) analysis. Peptide concentrations were estimated spectrophotometrically at 205 nm (NanoDrop OneC, Thermo Fisher) and used to normalise injection amounts for mass spectrometry method.
3.3. Mass spectrometry analysis
Mass spectrometry was performed using a nanoACQUITY ultra-performance liquid chromatograph (UPLC) coupled to the SYNAPT G2-Si Q-TOF instrument (Waters, USA) as described by Da Paschoa et al., 2026. Briefly, runs consisted of three biological replicates of 2.0 μg of peptides. During separation, samples were loaded onto a nanoAcquity UPLC M-Class Symmetry C18 trap column (180 μm × 20 mm, 100 Å, 5 μm, 2D; Waters) at a flow rate of 5 μL min–1 for 3 min and then onto a nanoAcquity UPLC M-Class HSS T3 reversed-phase analytical column (75 μm × 150 mm, 100 Å, 1.8 μm; Waters) at a flow rate of 400 nL min–1. The column temperature was set to 45 °C. A binary gradient was used for peptide elution, where mobile phase A consisted of water (Tedia, USA) with 0.1 % formic acid and mobile phase B consisted of acetonitrile with 0.1 % formic acid (Supelco, Germany).
Mass spectra were acquired in positive ion mode, incorporating ion mobility separation and data-independent acquisition (HDMSE). All mass spectral data were acquired using MassLynx software (v4.1, Waters).
3.4. Proteomic data analysis
Mass spectral data were processed in the ProteinLynx Global SERVER (PLGS v3.02, Waters), and quantified label-free using ISOQuant v1.7, applying the processing parameters as described by Da Paschoa et al., 2026. Protein identification was performed against the Vitis vinifera proteome reference (UniProtKB, Taxon ID 29760). The mass spectrometry proteomics data, the complete description step-by-step of the proteomic methods and setting parameters, and the complete list of identified proteins from proteomics analysis were accessed from the ProteomeXchange Consortium (Deutsch et al., 2023) via the PRIDE (Perez-Riverol et al., 2022) partner repository, with the dataset identifier PXD061737.
Only proteins consistently detected in all three biological replicates were considered for analysis. Label-free quantification values obtained from ISOQuant were log2-transformed and statistically evaluated by Student’s t-test (pairwise comparisons between stages). Proteins were classified as differentially regulated when they met both thresholds: p < 0.05 and log2 fold change (log2FC) > 0.6 (up-regulated) or < −0.6 (down-regulated). Functional enrichment analysis was performed in OmicsBox 3.0.29 (http://www.biobam.com/omicsbox), and clustering of differentially regulated proteins was conducted with the R package Mfuzz.
4. Data analysis
The physiological, biochemical, and enzymatic activity data were obtained from five biological replicates per developmental stage, each replicate consisting of one bunch collected from an independent plant (n = 5). For fruit quality parameters (diameter, firmness, total soluble solids, titratable acidity) and biochemical assays (membrane integrity, lipid peroxidation, inorganic phosphate, enzymatic activities, protein content), results are presented as mean ± standard deviation (SD).
Normality of data distribution was verified using the Shapiro–Wilk test, and homogeneity of variances was assessed by Levene’s test. When assumptions were met, differences among ripening stages were evaluated by one-way analysis of variance (ANOVA) followed by Tukey’s HSD post hoc test (α = 0.05). All statistical analyses were performed with GraphPad Prism v10.0 (GraphPad Software, San Diego, CA, USA).
Results
1. Fruit development and quality traits
Our comprehensive analysis revealed significant developmental changes in both physiological parameters and protein profiles throughout grape berry maturation. The ripening process was characterised by progressive increases in berry diameter (21.3 % increase from EL 33 to EL 39) and fresh mass (38.7 % increase), accompanied by rising total soluble solids (from 8.2 to 18.5 °Brix) and pH (from 3.1 to 3.8), while titratable acidity decreased by 62 % (Figure 1A-E).
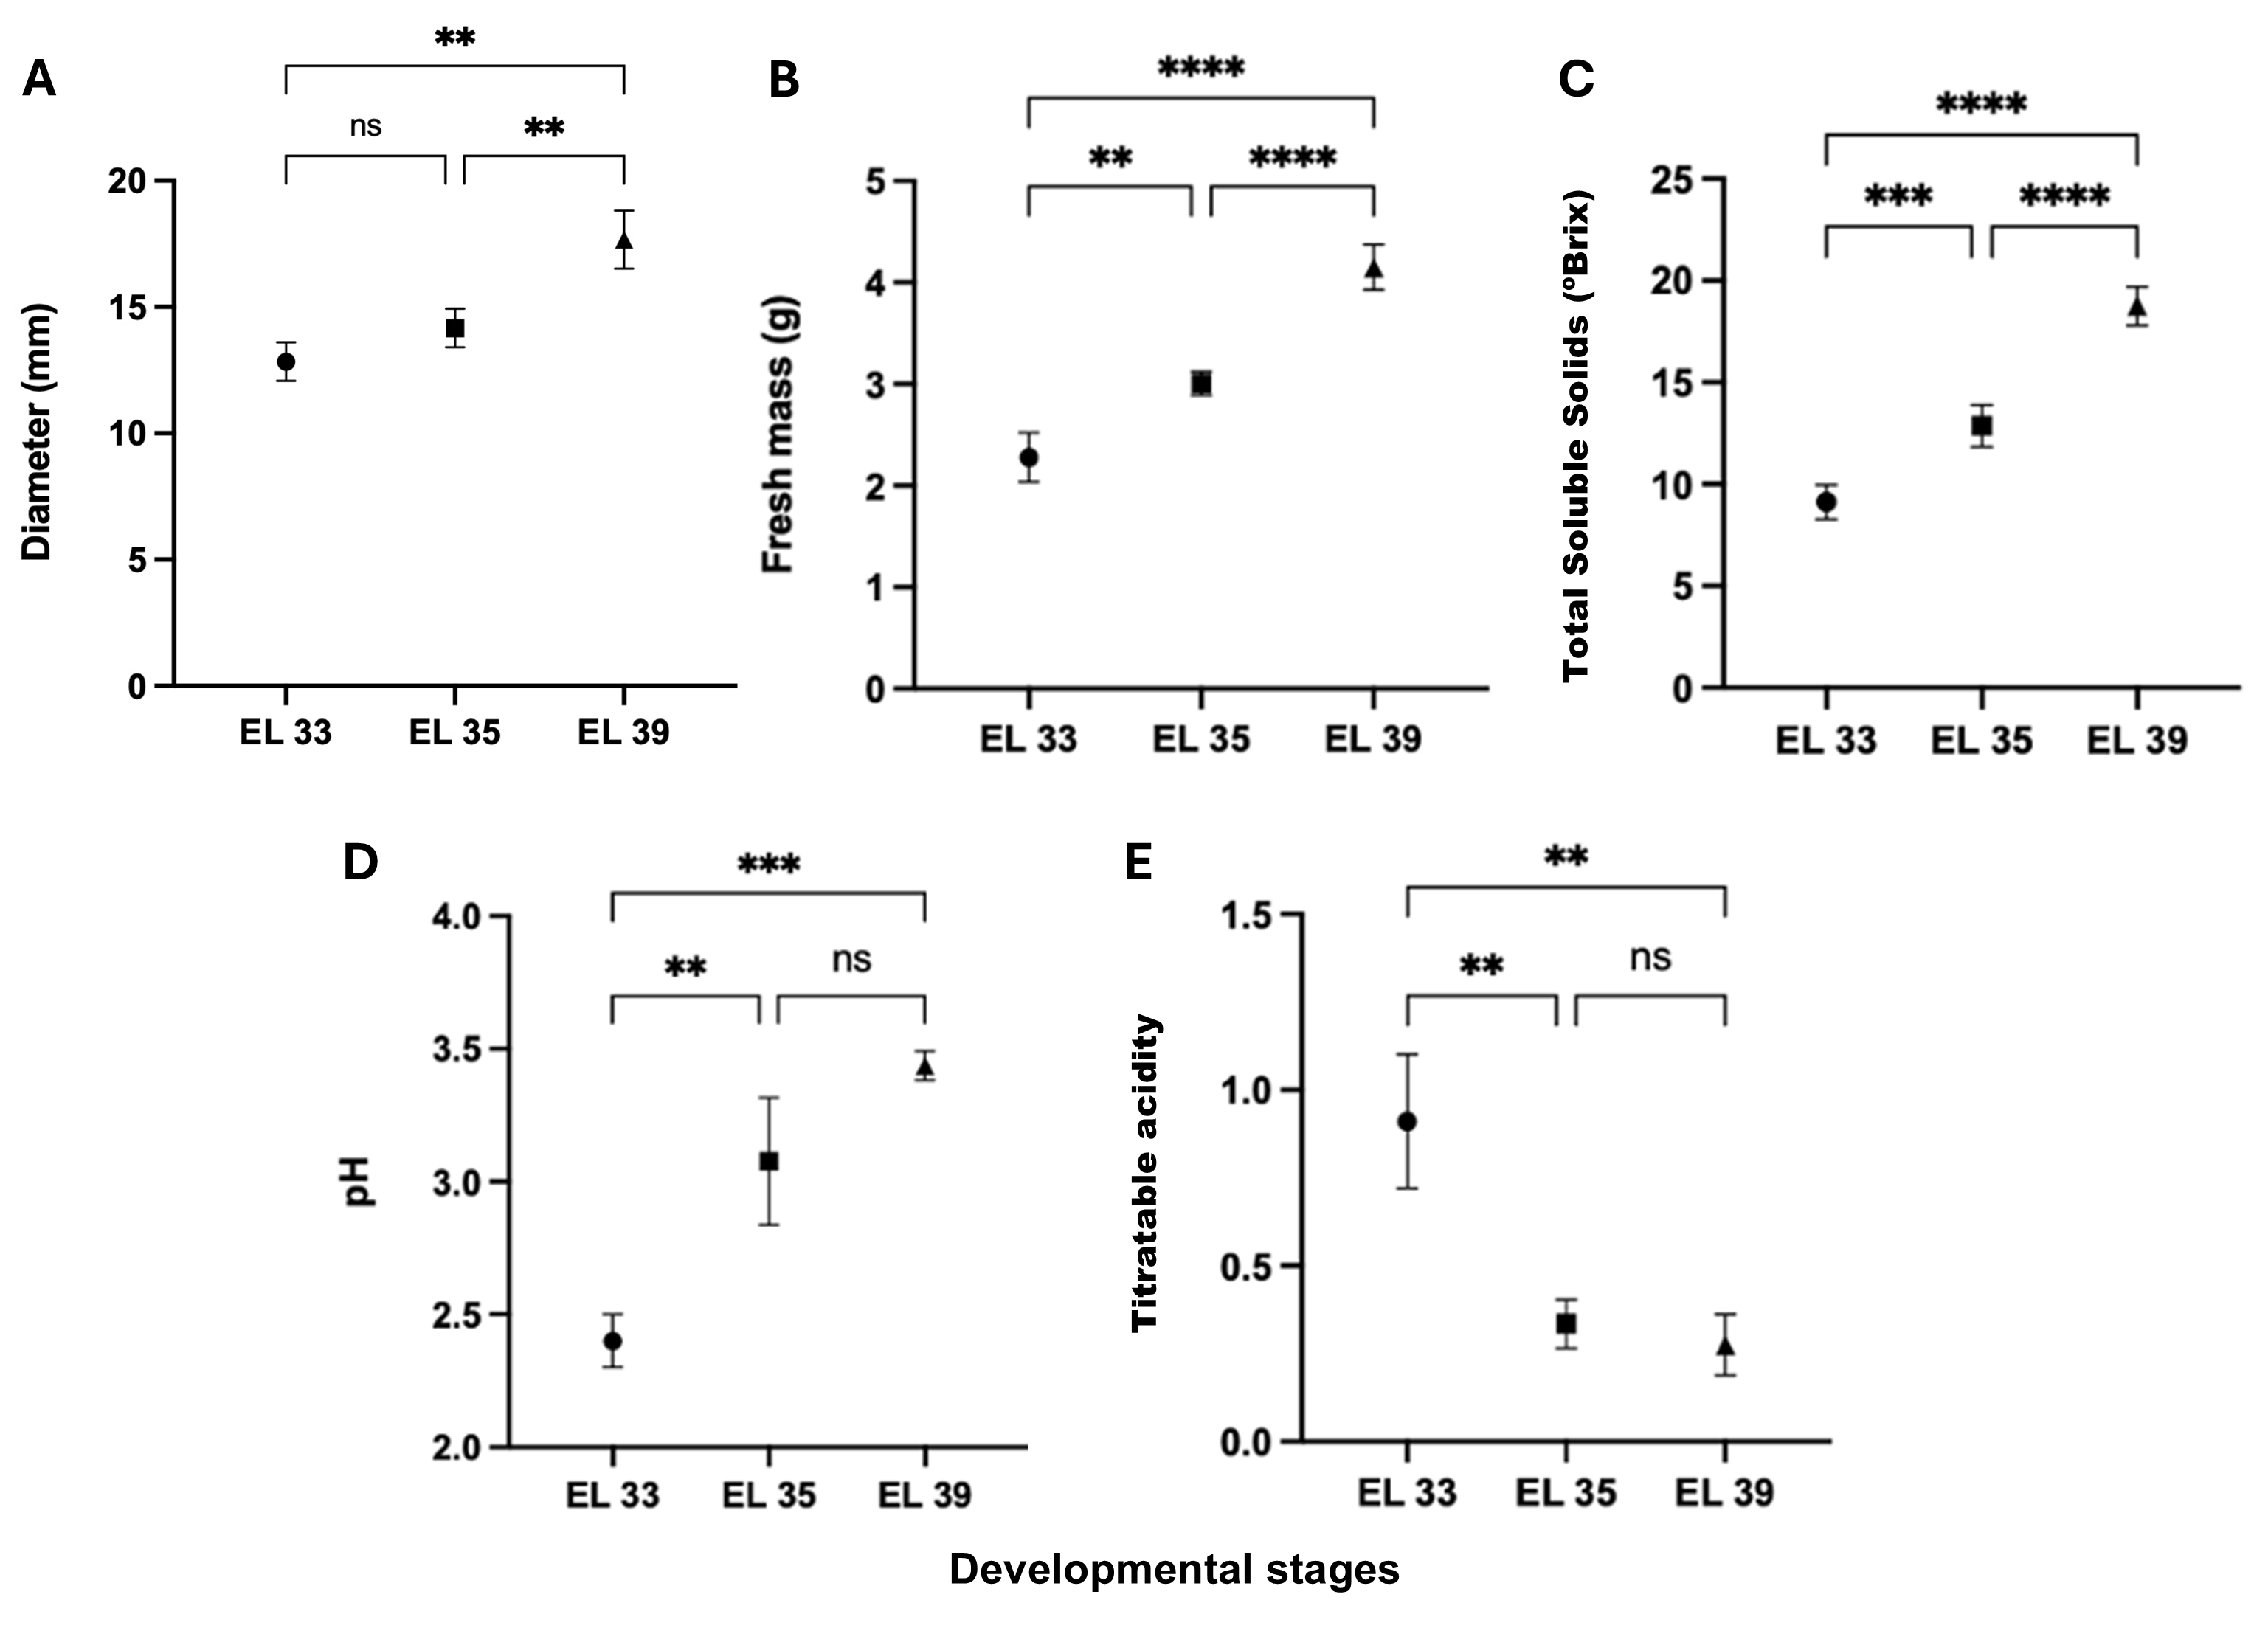
Figure 1. Diameter (A), fresh mass (B), total soluble solids (C), pH (D), and titratable acidity (E) from Niagara Rosada berries in EL 33, EL 35, and EL 39 developmental stages. Bars represent means ± standard deviation. Data differences are indicated with asterisks (One-way ANOVA, P < 0.05 and complementary Tukey test at 95 %). ****: p < 0.0001, ***: p < 0.001, **: p < 0.01, *: p ≤ 0.05, ns: not significant. EL 33 = berries still hard and green (pre-veraison), EL 35 = berries begin to colour and enlarge (veraison), and EL 39 = berries over-ripe.
2. Inorganic phosphate and lipid peroxidation
Inorganic phosphate (Pi) concentration differed significantly among the developmental stages (Table 1), with 6.91 ± 2.45 µmol g–1 FM at EL 33, 14.02 ± 0.51 at EL 35, and 12.33 ± 6.43 at EL 39. However, the non-significance between EL 33 and EL 39 indicates that phosphate leakage from cells was negligible, supporting the observation that membranes remained functionally intact during ripening.
Malondialdehyde (MDA), used as an indicator of lipid peroxidation, remained low throughout all developmental stages. The concentrations were 3.99 ± 1.40 nmol mL–1 FM at EL 33, 6.46 ± 1.11 at EL 35, and 9.19 ± 1.15 at EL 39. No differences were detected (p > 0.05) when comparing between adjacent stages, but oxidative damage to membrane lipids was increased from EL 33 to EL 39.
Parameter | Developmental stages | Significance | |||
EL 33 | EL 35 | EL 39 | |||
Pi (μmol g–1) | 6.91 ± 2.45 | 14.02 ± 0.51 | 12.33 ± 6.43 | EL 33/EL 35* EL 33/EL 39** EL 35/EL 39ns | |
MDA (nmol mL–1) | 3.99 ± 1.40 | 6.46 ± 1.11 | 9.19 ± 1.15 | EL 33/EL 35ns EL 33/EL 39** EL 35/EL 39ns | |
3. Catalase, ascorbate peroxidase and superoxide dismutase activities and protein abundance
Distinct patterns of antioxidant enzyme activity were observed throughout the developmental stages. Catalase (CAT) activity was highest at EL 33 (24 mU mg–1 protein), then it declined sharply at EL 35 (7 mU mg–1 protein) and partially recovered at EL 39 and EL 41 (15 and 17 mU mg–1 protein, respectively) (Figure 2A). Ascorbate peroxidase (APX) remained unchanged throughout mesocarp development. Although mean values tended to be higher at EL 33 (35 mU mg–1 protein), and EL 35 (32.5 mU mg–1 protein) and lower at EL 39 and EL 41 (both 23 mU mg–1 protein), none of the pairwise comparisons was significant. Thus, APX activity was maintained without clear developmental modulation through the evaluated stages (Figure 2B). SOD activity exhibited a stage-dependent change during mesocarp development, as the activity remained statistically similar between EL 33 and EL 35, with estimated values of approximately 0.32–0.34 mU mg–1 protein. A significant increase occurred at EL 39, where SOD activity reached 0.50 mU mg–1 protein, representing the highest value among the stages. At EL 41, activity declined to 0.35 mU mg–1 protein, which is significantly lower than at EL 39 and statistically comparable to the earlier stages (Figure 2C).
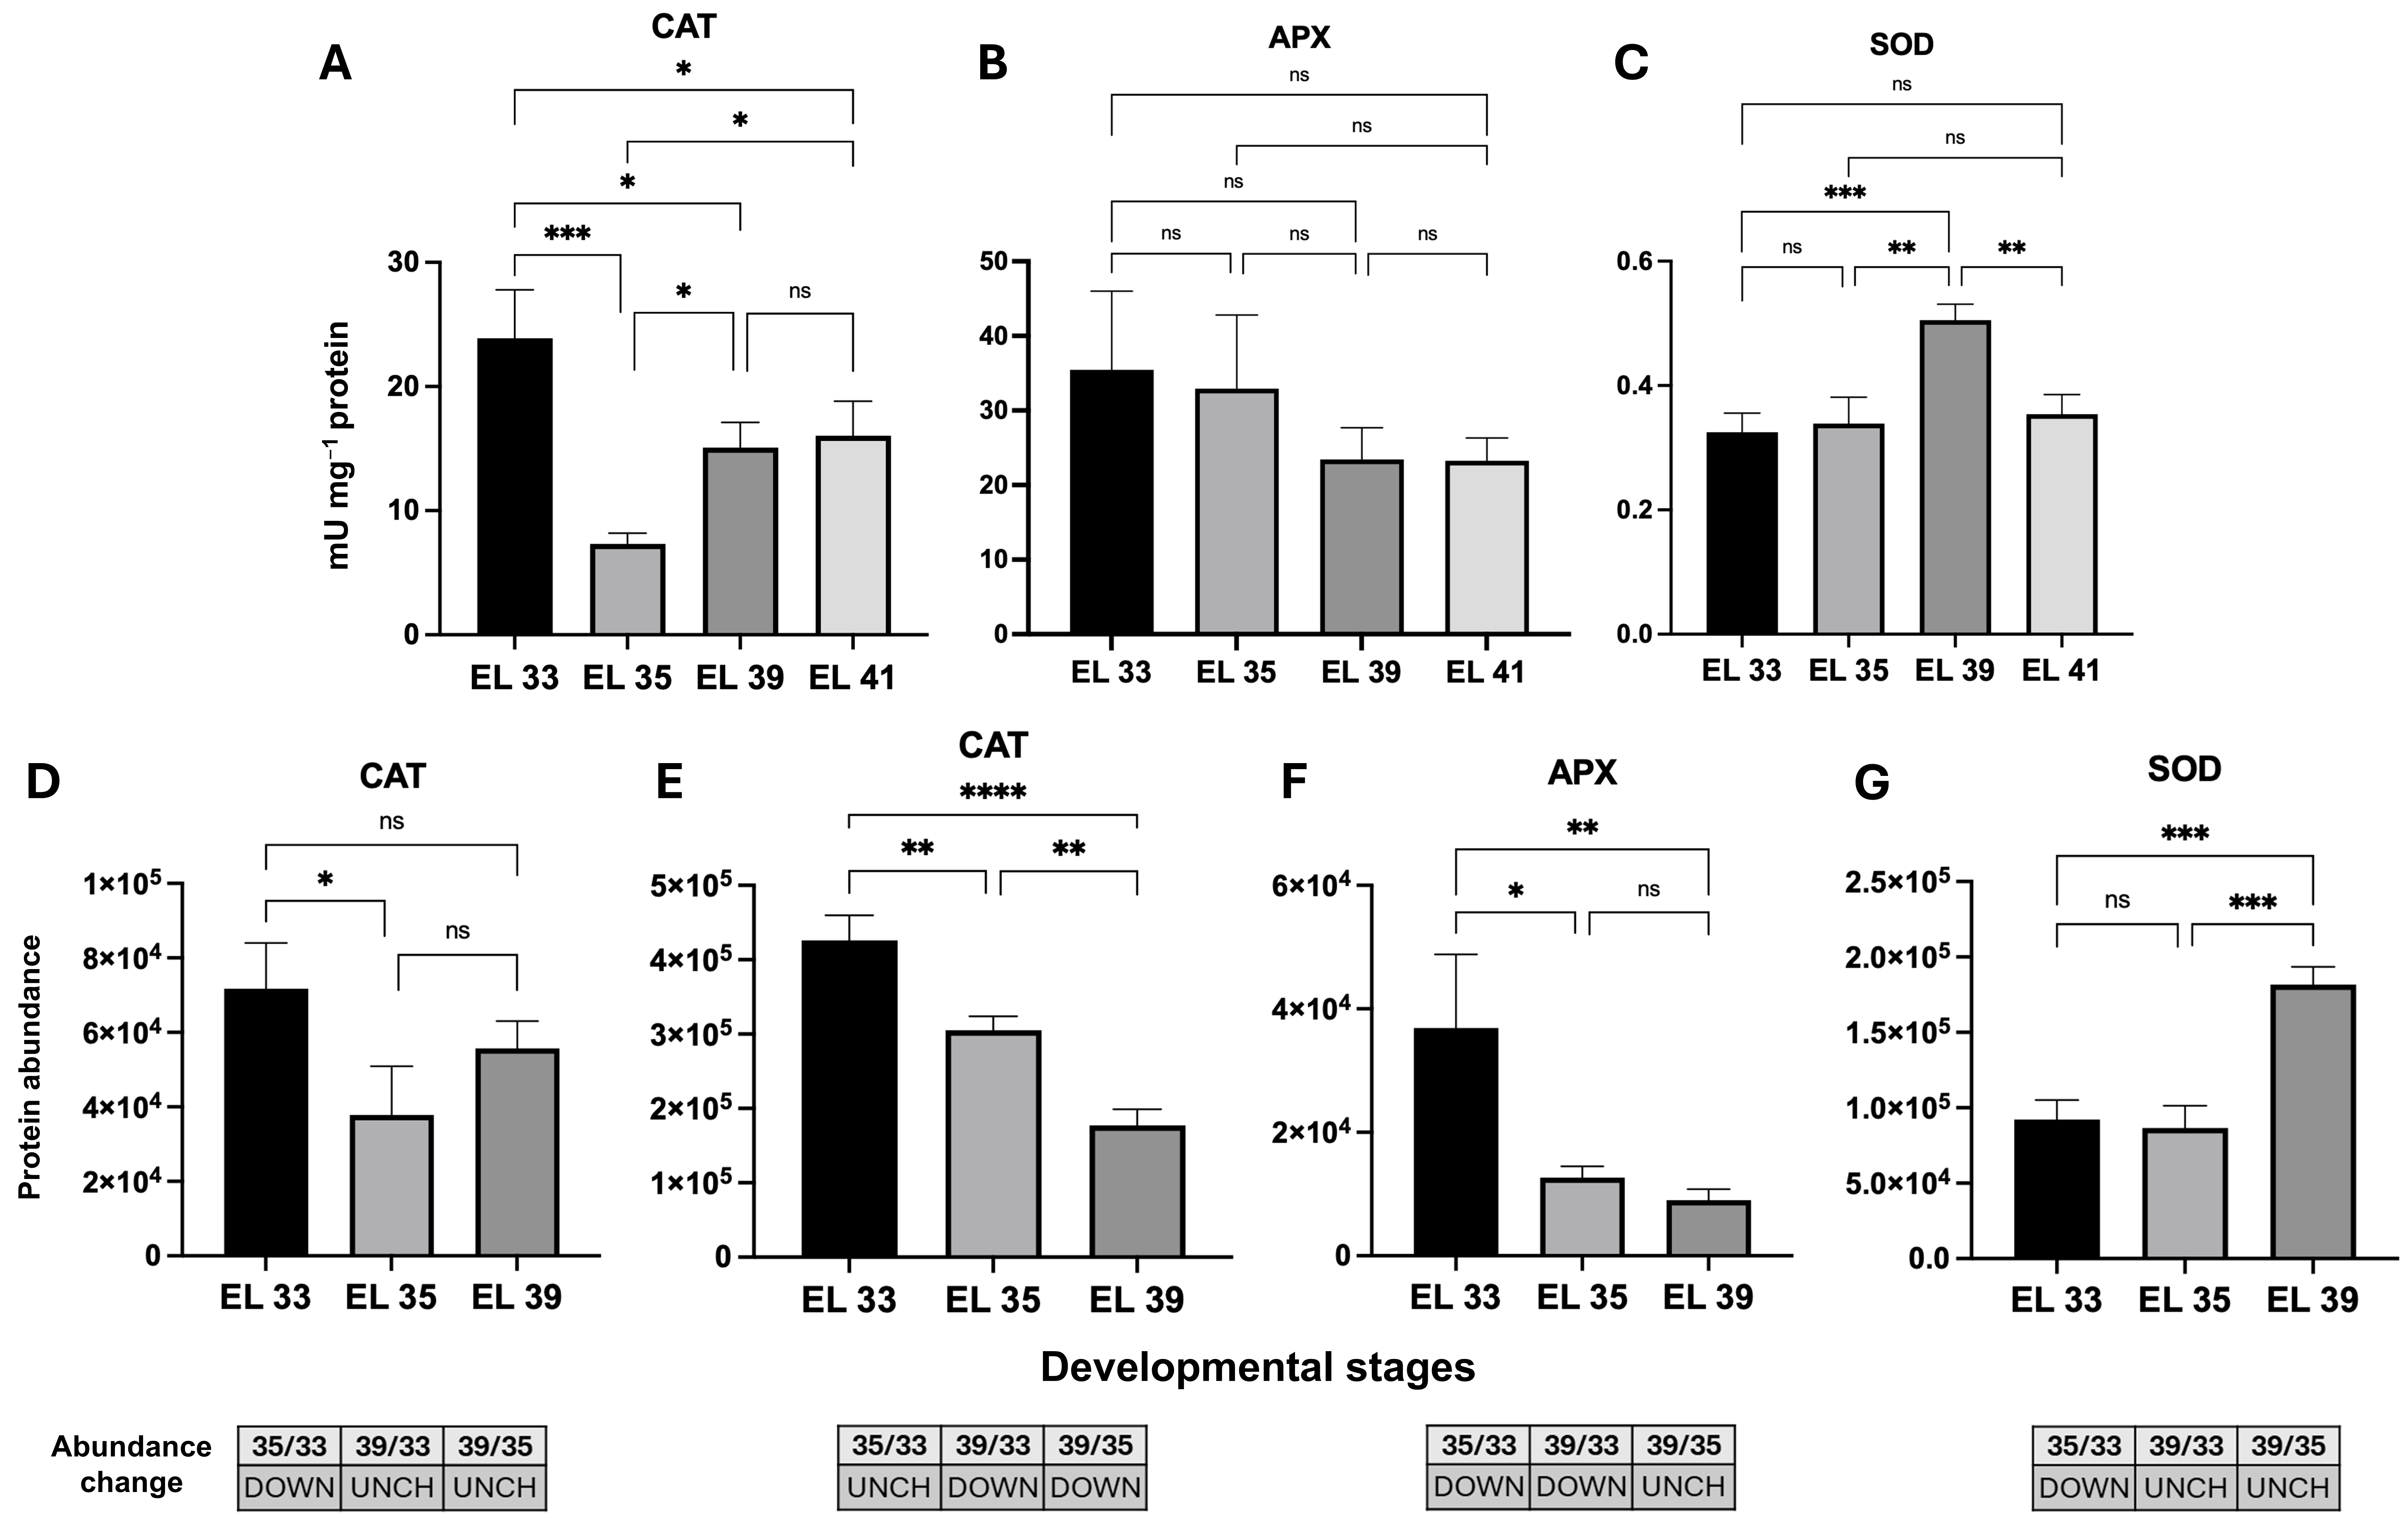
Figure 2. Enzymatic activities of catalase (CAT) (A), ascorbate peroxidase (APX) (B) and superoxide dismutase (SOD) (C) and their differential accumulation (CAT, D-E; APX, F; SOD, G) through ripening stages from Niagara Rosada berries in EL 33, EL 35 and EL 39 developmental stages. UniProtKB Primary accession numbers: D7UD99 (D), F6I0K4 (E), F6I106 (F), and F6HC76 (G). Bars in D-G correspond to means ± standard deviation (n = 3). Abundance change was determined by the Student’s t-test (p < 0.05); proteins with a p-value < 0.05 were deemed up-regulated (UP), if the log2 value of the fold change (log2FC) was > 0.60 and down-regulated (DOWN), if it was < −0.60; otherwise, proteins were unchanged (UNCH). Bars in A-C correspond to means ± standard deviation, and differences were evaluated by one-way ANOVA (p < 0.05) followed by Tukey’s test at 95 % confidence. Significance levels: **** p < 0.0001; *** p < 0.001; ** p < 0.01; * p ≤ 0.05; ns: not significant. EL 33 = berries still hard and green (pre-veraison), EL 35 = berries begin to colour and enlarge (veraison), and EL 39 = berries over-ripe.
Two CAT isoforms exhibited differential profiles. The CAT associated with Cluster 3 prevailed at early stages (UniProtKB Primary accession number D7UD99, Figure 2D), decreasing through maturation, while the isoform in Cluster 6 (F6I0K4, Figure 2E) accumulated only at EL 33 and remained at low abundance thereafter. APX (F6I106) was associated predominantly with Cluster 3 (Figure 2F). The protein accumulated mainly at EL 33 and declined thereafter. SOD (F6HC76, Cluster 1) accumulated predominantly at EL 39, with lower abundance at earlier stages (Figure 2G).
4. Peroxidase activity and PX/AO protein abundance
Peroxidase (PX) displayed a steady decline, from 8.5 mU mg–1 protein at EL 33 to 3.0 mU mg–1 protein at EL 39, indicating reduced contribution of this enzyme to hydrogen peroxide detoxification, which in turn reflects reduced peroxidase-mediated H2O2-consuming capacity during mesocarp development (Figure 3A).
PX (E0CRP4) and amine oxidase (AO, F6HUI4) exhibited contrasting accumulation patterns (Figure 3B-C). AO reached maximal abundance at EL 35 and declined thereafter, whereas PX remained comparatively stable but accumulated gradually toward EL 39.
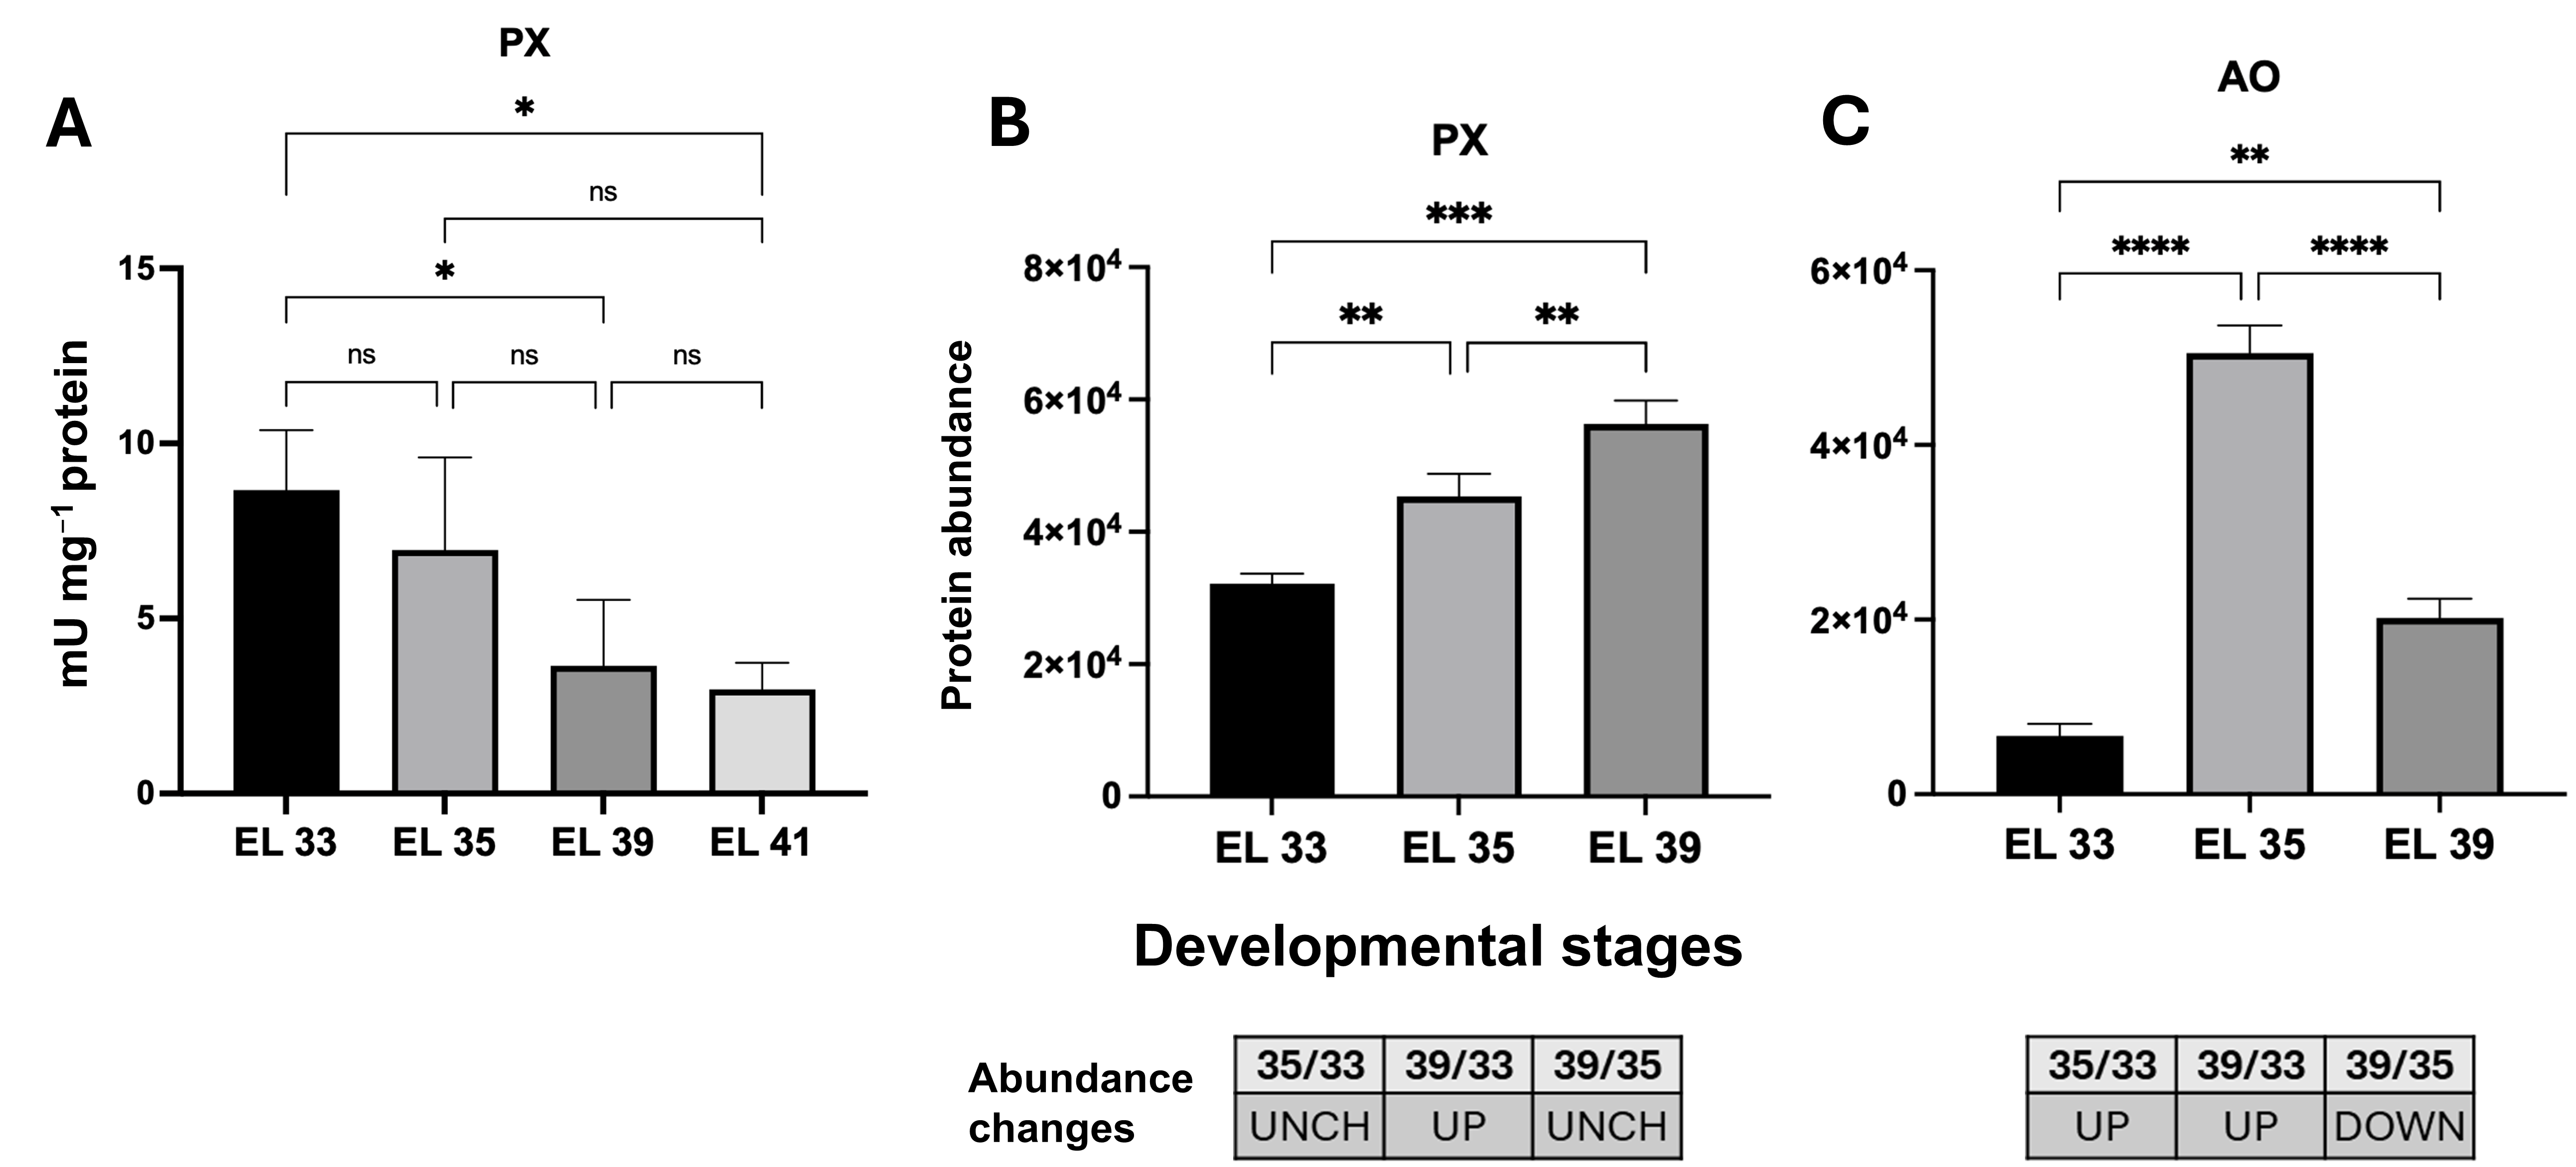
Figure 3. Enzymatic activity of peroxidase (PX) (A), and the PX (B) and amine oxidase (AO) (C) differential accumulation throughout the developmental stages. UniProtKB Primary accession numbers: E0CRP4 (B), F6HUI4 (C). Bars in B-C correspond to means ± standard deviation (n = 3). Abundance change was determined by the Student’s t-test (p < 0.05); proteins with a p-value < 0.05 were deemed up-regulated (UP) if the log2 value of the fold change (log2FC) was > 0.60 and down-regulated (DOWN) if it was < −0.60; otherwise, proteins were unchanged (UNCH). Bars in A correspond to means ± standard deviation, and significance was assessed by one-way ANOVA (p < 0.05) followed by Tukey’s test at 95 % confidence. Significance levels: **** p < 0.0001; *** p < 0.001; ** p < 0.01; * p ≤ 0.05; ns: not significant. EL 33 = berries still hard and green (pre-veraison), EL 35 = berries begin to colour and enlarge (veraison), and EL 39 = berries over-ripe.
5. Glutathione reductase and glutathione peroxidase activities and protein abundance
NADPH-linked enzymes exhibited distinct developmental profiles (Figures 4 and 5). Glutathione reductase (GR) activity was not detected at EL 33 and EL 35, but appeared at the later stages, reaching approximately 3.5 mU mg–1 protein at EL 39 and 3.1 mU mg–1 protein at EL 41. These two stages did not differ significantly, indicating that GR activity was restricted to the late phase of mesocarp development (Figure 4A). Glutathione peroxidase (GPX) activity changed markedly during development, increasing from approximately 1.7 mg glutathione mg–1 protein at EL 33 to a maximum of 2.8 mg glutathione mg–1 protein at EL 35. Thereafter, activity declined sharply to about 1.0 at EL 39 and 0.9 at EL 41, with no significant difference between these last two stages. Thus, GPX activity was transiently enhanced at EL 35, whereas GR activity became evident only at EL 39–EL 41, suggesting distinct temporal regulation of these NADPH-linked glutathione-dependent components (Figure 4B).
GR (D7TS92, Cluster 4) reached its highest abundance at EL 35 (Figure 4C). Two GPX isoforms (D7TW03 and F6HUD1) accumulated toward EL 39 (Figure 4D-E): the first, in Cluster 1, reached its highest abundance at maturity, while the second, in Cluster 2, increased gradually during the course of ripening.
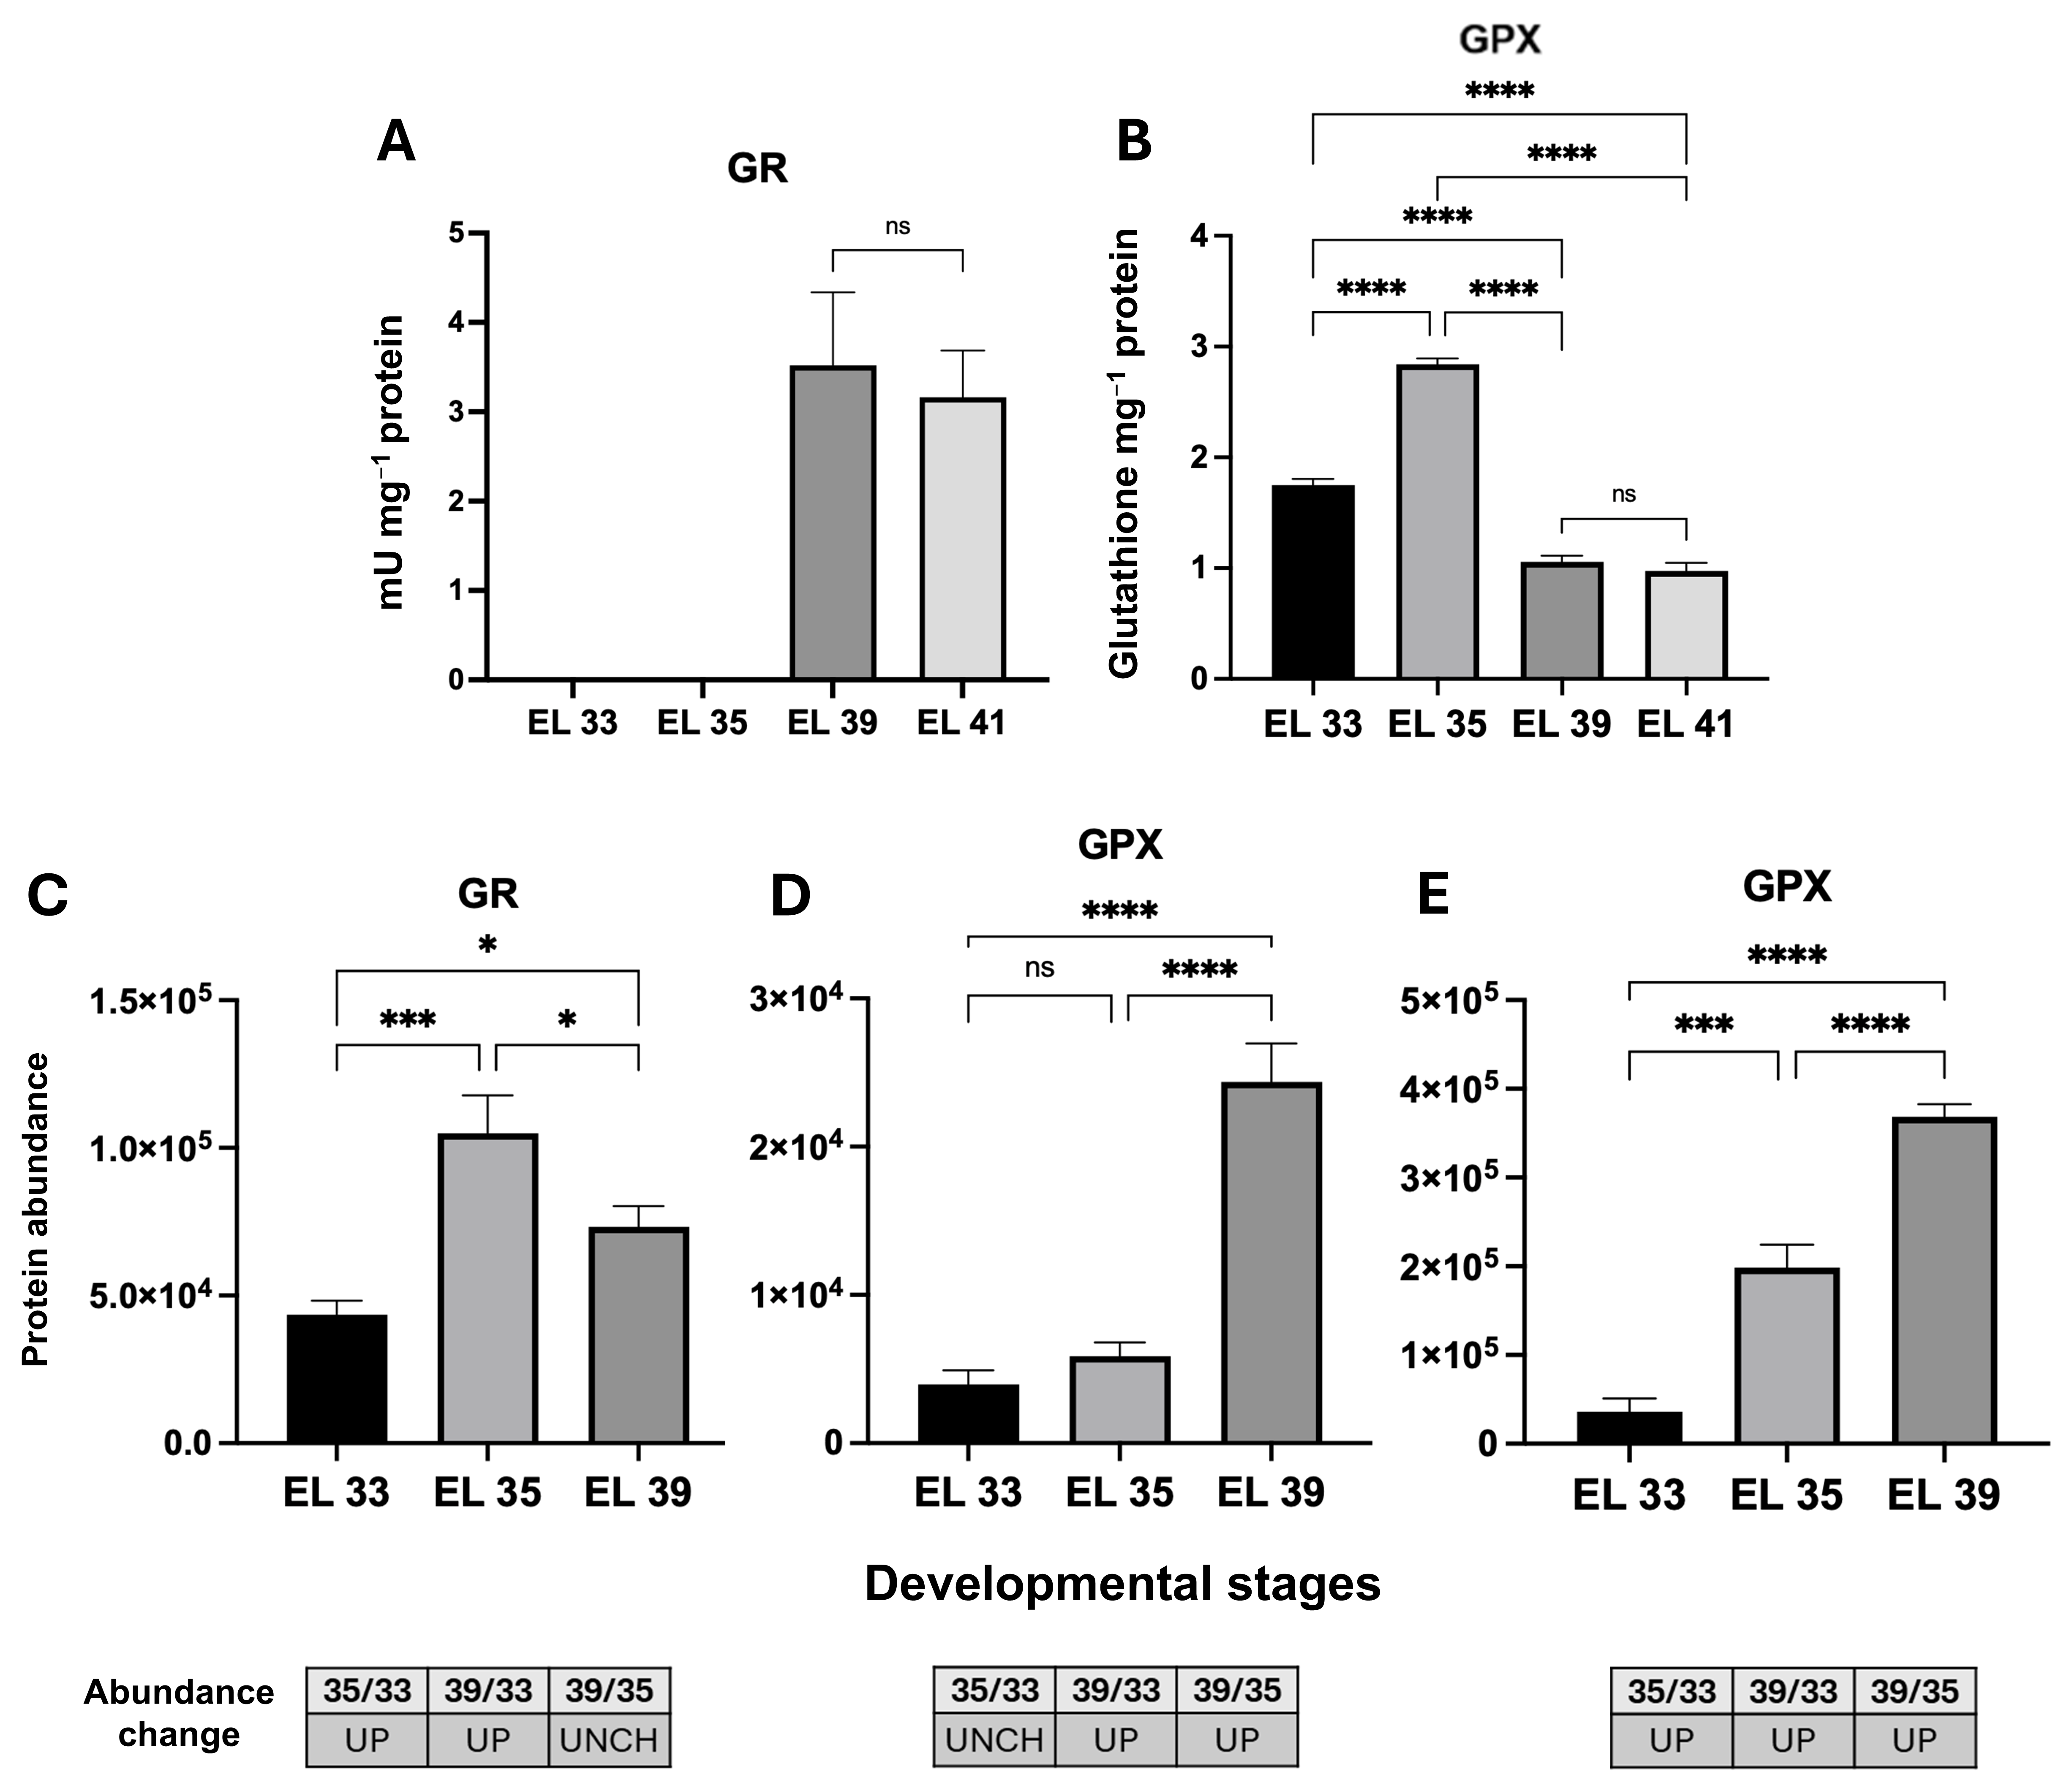
Figure 4. Enzymatic activities of glutathione reductase (GR) (A) and glutathione peroxidase (GPX) (B) and their differential accumulation (GR, C; GPX, D-E) through ripening stages from Niagara Rosada berries in EL 33, EL 35 and EL 39 developmental stages. UniProtKB Primary accession numbers: D7TS92 (C), D7TW03 (D), F6HUD1 (E). Bars in C-E correspond to means ± standard deviation (n = 3). Abundance change was determined by the Student’s t-test (p < 0.05); proteins with a p-value < 0.05 were deemed up-regulated (UP) if the log2 value of the fold change (log2FC) was > 0.60 and down-regulated (DOWN) if it was < −0.60; otherwise, proteins were unchanged (UNCH). Bars in A-B correspond to means ± standard deviation, and differences were evaluated by one-way ANOVA (p < 0.05) followed by Tukey’s test at 95 % confidence. Significance levels: **** p < 0.0001; *** p < 0.001; ** p < 0.01; * p ≤ 0.05; ns: not significant. EL 33 = berries still hard and green (pre-veraison), EL 35 = berries have begun to change colour and enlarge (veraison), and EL 39 = over-ripe berries.
6. G6PDH activity and G6PDH/6PGL/6PGDH protein abundance
The glucose-6-phosphate dehydrogenase enzyme (G6PDH) activity declined during mesocarp development, from approximately 1.45 U mg–1 protein at EL 33 to 0.80 at EL 35, 0.25 at EL 39 and 0.18 at EL 41. The reduction was significant from EL 33 to EL 35 and from EL 35 to EL 39, whereas EL 39 and EL 41 did not differ significantly. Thus, G6PDH activity decreased mainly between EL 33 and EL 39, indicating a marked developmental reduction in NADPH-generating capacity via the oxidative pentose phosphate pathway (Figure 5A).
The G6PDH protein associated with cluster 4 (D7UBH2) (Figure 5B) prevailed at EL 33 with further decline at EL 35. On the other hand, 6-phosphogluconolactonase (6PGL, E0CVA1) abundance increased at EL 35 and was maintained during EL 39 (Figure 5C). Two isoforms of 6-phosphogluconate dehydrogenase (6PGDH; F6HUQ8 and F6HGH4) were identified, both exhibiting unchanged abundance profiles throughout the analysed developmental stages (Figure 5D-E).
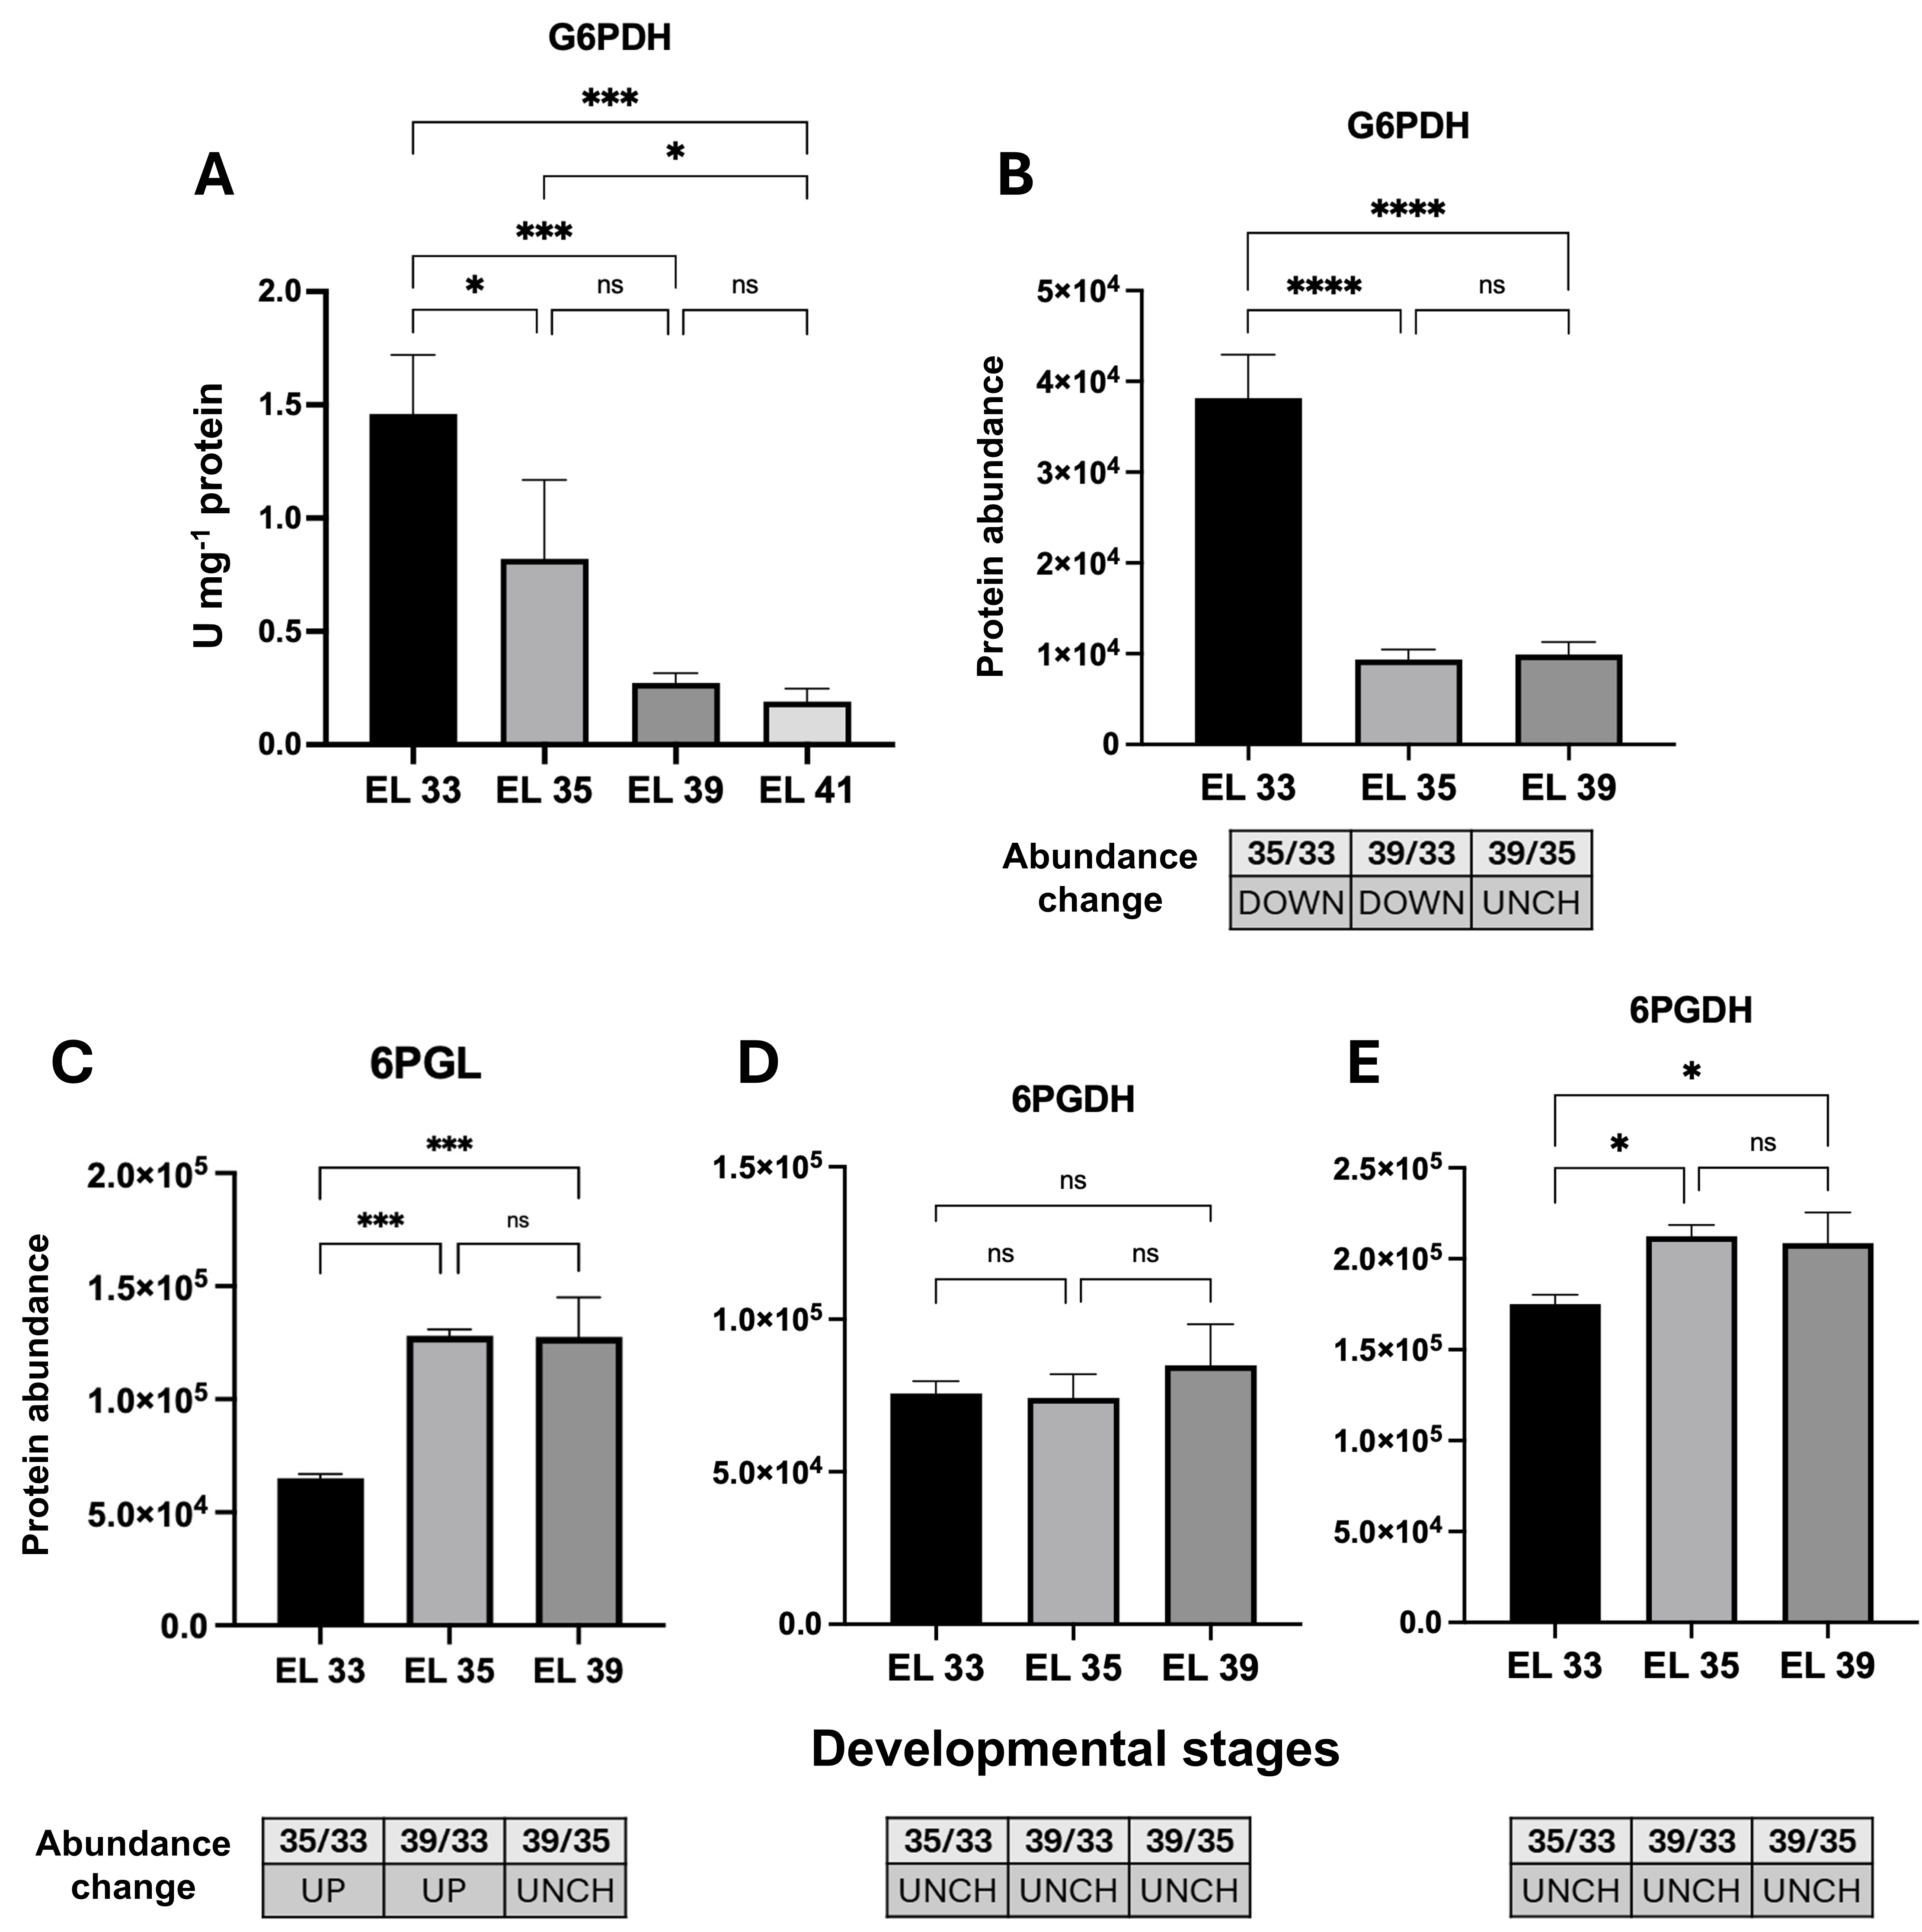
Figure 5. Enzymatic activity analysis of glucose-6-phosphate dehydrogenase (G6PDH) (A) and the differential accumulation of G6PDH (B), 6-phosphogluconolactonase (6PGL) (C), and 6-phosphogluconate dehydrogenase (6PGDH) isoforms (D, E). UniProtKB Primary accession numbers: D7UBH2 (B), E0CVA1 (C), F6HUQ8 (D), F6HGH4 (E). Bars in B-E correspond to means ± standard deviation (n = 3). Abundance change was determined by the Student’s t-test (p < 0.05); proteins with a p-value < 0.05 were deemed up-regulated (UP) if the log2 value of the fold change (log2FC) was > 0.60 and down-regulated (DOWN) if it was < −0.60; otherwise, proteins were unchanged (UNCH). Bars in A correspond to means ± standard deviation, and differences were evaluated by one-way ANOVA (p < 0.05) followed by Tukey’s test at 95 % confidence. Significance levels: ***, p < 0.001; **, p < 0.01; *, p ≤ 0.05; ns, not significant. EL 33 = berries still hard and green (pre-veraison), EL 35 = berries begin to colour and enlarge (veraison), and EL 39 = berries over-ripe.
7. Proteomic regulation of antioxidant-related processes
Comparative proteomic analysis identified 956 differentially regulated proteins (DRP) across developmental stages in at least one comparison. While 820 DRP were commonly present across all stages, we observed unique protein sets for each developmental stage: 49 at EL 33, 8 at EL 35, and 6 at EL 39 (Figure 6A). Clustering analysis revealed six distinct accumulation patterns, with particular note on Cluster 1 (147 proteins with a progressive increase) and Cluster 2, which were significantly enriched for oxidative stress response proteins (GO:0006979, p = 3.2 × 10⁻⁵) (Figure 6B-C).
Functional enrichment analysis highlighted key biological processes in antioxidant metabolism, with oxidative stress response and cellular oxidant detoxification being among the most represented throughout Niagara Rosada berry development.
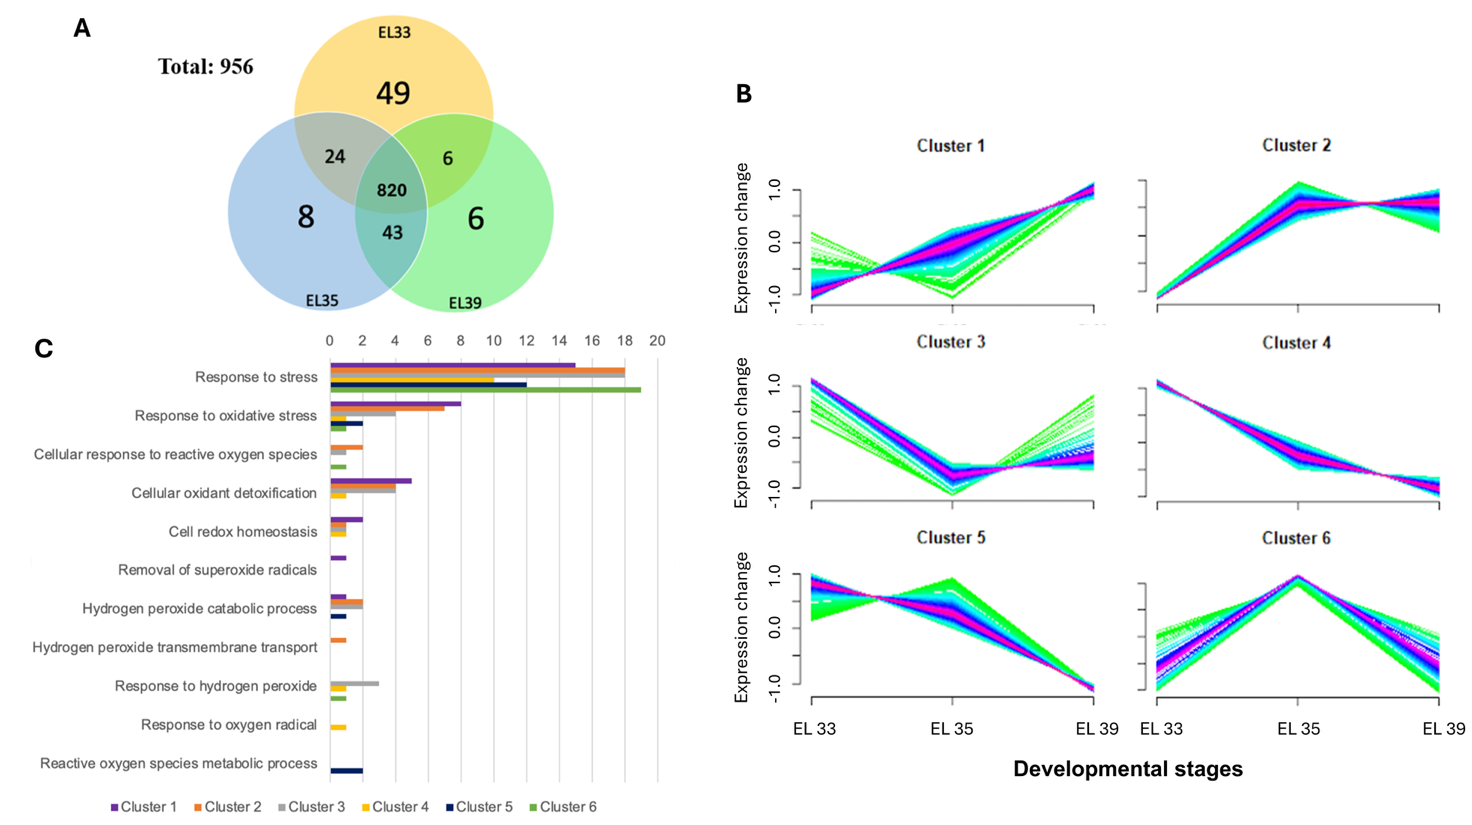
Figure 6. Venn diagram representing the total number of differentially accumulated proteins (A) from Niagara Rosada berries analysed in EL 33, EL 35, and EL 39 developmental stages, together with their clustering analysis (B). The total number of proteins by biological processes related to antioxidant processes is represented in C. Bars represent the number of proteins associated with each process per cluster. Proteins with a p-value < 0.05 were deemed up-regulated if the log2 value of the fold change (log2FC) was > 0.60 and down-regulated if it was < −0.60; otherwise, proteins were unchanged (UNCH). EL 33 = berries still hard and green (pre-veraison), EL 35 = berries begin to colour and enlarge (veraison), and EL 39 = berries over-ripe.
8. Thioredoxin reductase, peroxiredoxin and isocitrate dehydrogenase abundance
Thioredoxin reductase (TrxR; F6I0C1) remained constant throughout development, whereas peroxiredoxin (Prx; D7TH54, Cluster 4) was more abundant at EL 33 and declined thereafter (Figure 7A-B), indicating an early role in redox buffering followed by decreased demand during maturation. The two isocitrate dehydrogenase (ICDH) isoforms identified (A5BX54 and D7T0Z7, Cluster 3) exhibited a similar stage-dependent decrease toward EL 39 (Figure 7C-D).
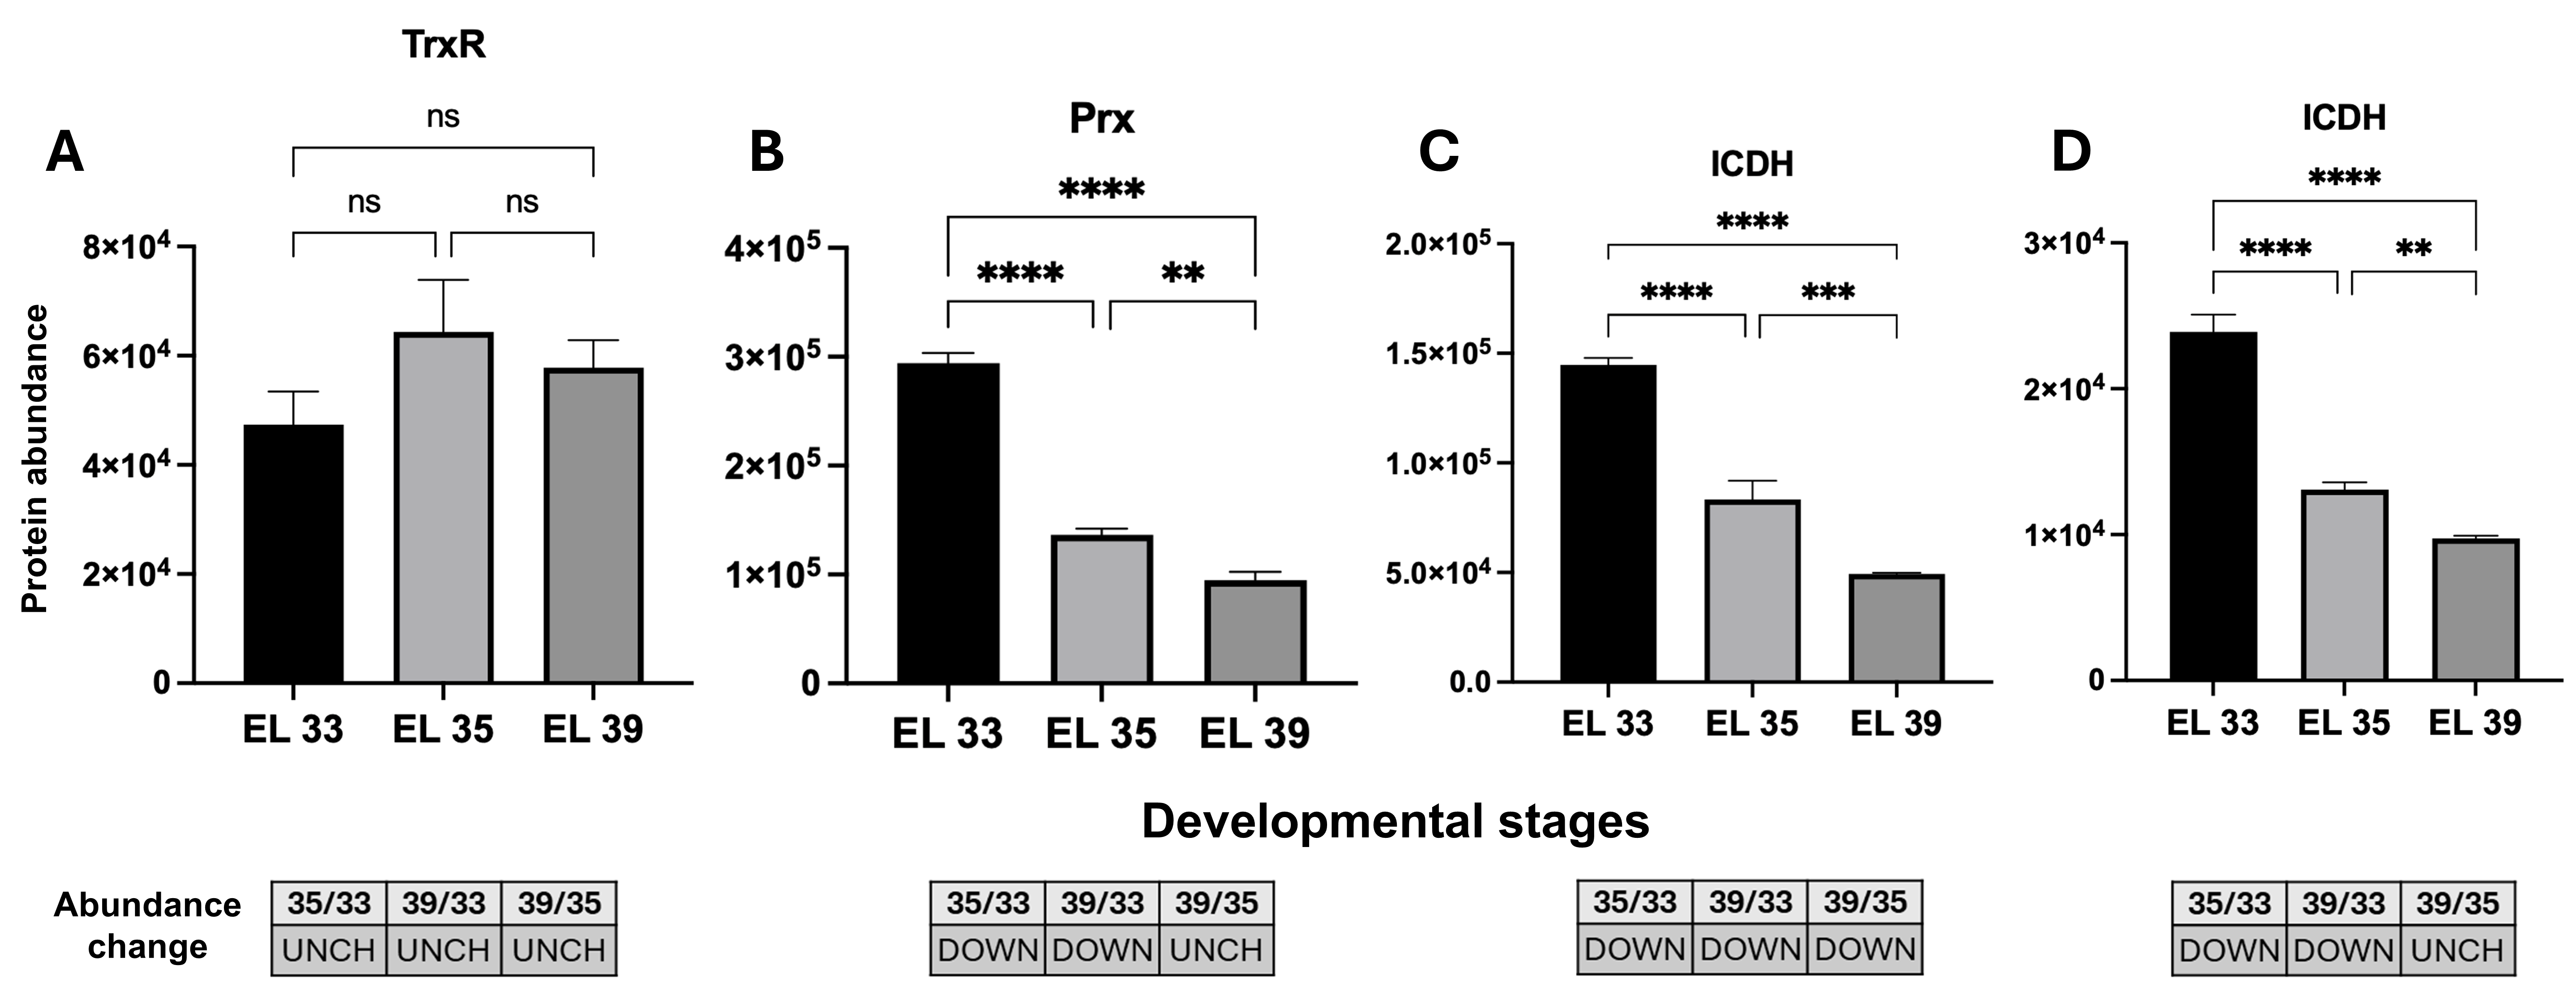
Figure 7. Differential accumulation analysis of thioredoxin reductase (TrxR) (A), peroxiredoxin (Prx) (B), and isocitrate dehydrogenase (ICDH) isoforms (C, D) through ripening stages from Niagara Rosada berries in EL 33, EL 35 and EL 39 developmental stages. UniProtKB Primary accession numbers: F6I0C1 (A), D7TH54 (B), A5BX54 (C), D7T0Z7 (D). Bars correspond to means ± standard deviation (n = 3). Abundance change was determined by the Student’s t-test (p < 0.05); proteins with a p-value < 0.05 were deemed up-regulated (UP) if the log2 value of the fold change (log2FC) was > 0.60 and down-regulated (DOWN) if it was < −0.60; otherwise, proteins were unchanged (UNCH). Significance levels: **** p < 0.0001; *** p < 0.001; ** p < 0.01; * p ≤ 0.05; ns: not significant. EL 33 = berries still hard and green (pre-veraison), EL 35 = berries begin to colour and enlarge (veraison), and EL 39 = berries over-ripe.
Discussion
This study aimed to characterise redox metabolism during the ripening of cv. Niagara Rosada berries through the integration of proteomic profiling and enzymatic assays. Pi and lipid peroxidation profiles suggested moderate membrane-associated oxidative changes during ripening, without evidence of extensive oxidative deterioration. Antioxidant enzyme activities were stage-dependent, where CAT followed a biphasic profile, SOD increased towards maturity, PX declined progressively, and APX, GR, and GPX exhibited distinct temporal patterns. Proteomic analysis supported these patterns, identifying 956 differentially accumulated proteins, with a predominance of antioxidant isoforms and NADPH-generating dehydrogenases at specific developmental stages. Overall, Niagara Rosada berries exhibited coordinated redox adjustment during ripening, associating antioxidant enzyme activity with proteomic reprogramming.
Grape berry development involved coordinated morphological and physiological transitions that define the onset and progression of ripening. Berry diameter and fresh mass increased progressively, reflecting active cell expansion and the accumulation of soluble compounds, primarily sugars and water (Figure 1A-C). These physical changes occurred concomitantly with a decline in titratable acidity and an increase in pH (Figure 1D-E), consistent with the established shift from organic acid accumulation to hexose accumulation during grape berry ripening (Lu et al., 2024).
In our proteomic dataset, several proteins associated with oxidative responses and cellular oxidant detoxification accumulated progressively during ripening. This indicates an active remodelling of redox metabolism during berry development, enhancing the capacity to maintain ROS within physiological limits. Such regulation is essential, because ROS function not only as oxidants but also as signalling molecules that mediate developmental transitions (Møller, 2001; Neill, 2002; Imlay, 2003; Pilati et al., 2014).
The abundance patterns of PX and AO in the mesocarp are consistent with their possible contribution to H2O2 formation at early and late ripening stages (Figure 3B-C). This points to an active and developmentally regulated redox flux rather than passive oxidative accumulation. AO, localised in mitochondria, contributes to controlled H2O2 formation through alternative respiratory routes that modulate the cellular redox environment, as reported in ROS-mediated mitochondrial signalling (Møller & McPherson, 1998; Belenghi, 2004; Cona et al., 2005). PX, although commonly associated with H2O2 removal, may operate reversibly under specific redox conditions, sustaining ROS turnover in metabolically active tissues. Comparable enzyme behaviour has been recorded in grapevine buds, where PX activity increases alongside H2O2 during deep endodormancy (Pérez et al., 2021). Overall, these responses maintain redox homeostasis during ripening while allowing H2O2 to operate within its signalling range.
Although ROS-related enzymatic activity changed during ripening, Pi and MDA profiles did not support extensive oxidative deterioration of the mesocarp. Pi increased from EL 33 to EL 35 and EL 39, whereas no further increase occurred between EL 35 and EL 39 (Table 1). MDA also increased during ripening, with higher values at EL 39 than at EL 33. These responses indicate moderate membrane-associated oxidative changes during berry development rather than progressive cellular collapse. This interpretation is consistent with previous evidence that vitality loss in Niagara Rosada mesocarp occurs independently of extensive cell death (Monteiro et al., 2025). Similar regulation has been described in grape berries, where oxidative changes may accompany ripening while tissue functionality is retained during development (Caravia et al., 2015; Krasnow et al., 2008).
Our enzyme profiles identified CAT as the early, high-capacity peroxide buffer, with maximal abundance at initial stages (Figure 2D-E) and a biphasic activity course (lower mid-development, recovery at maturity; Figure 2A). This pattern is compatible with post-translational control to handle episodic H2O2 rises (Van Breusegem et al., 2001; Gupta, 2010). APX, with high affinity for H2O2, accumulated at EL 33 (Figure 2B) while keeping activity near-constant through maturation (Figure 2F), thereby securing baseline scavenging by maintaining peroxide within its functional range (De Gara, 2004; Dąbrowska et al., 2007). In contrast, SOD gains both abundance and activity at EL 39 (Figure 2C-G), contributing to the peroxide pool late in ripening and supporting signalling-dependent adjustments linked to maturation (Mittler, 2002; Bhattacharjee, 2010). These profiles outline a division of functionality: CAT covers high-load detoxification, APX provides fine control, and SOD participates in late-stage superoxide conversion, contributing to the redox set-point compatible with mesocarp functionality from early growth to maturity. Adjustments in oxidative metabolism have also been reported in other fruits. In peach, for instance, CAT and GPX activities rise during late ripening in response to temperature shifts (Huan et al., 2016), while in grape, declining internal O2 concentrations drive metabolic transitions that alter mitochondrial respiration (Romieu et al., 1992; Xiao et al., 2018a; Xiao et al., 2018b). These converging patterns emphasise the conserved nature of oxidative control mechanisms that sustain metabolic flexibility in fleshy fruits.
NADPH-producing dehydrogenases displayed predominantly early-stage profiles during Niagara Rosada berry development. G6PDH activity was highest at EL 33 and declined markedly towards EL 39–EL 41, while the corresponding G6PDH protein also prevailed at the early stage (Figure 5A-B). Similarly, ICDH isoforms were more abundant at EL 33 and decreased towards EL 39 (Figure 7C-D). These profiles suggest that NADPH-generating capacity through G6PDH- and ICDH-linked routes was more prominent during early mesocarp development, when biosynthetic activity and basal antioxidant buffering are expected to impose a high demand for reducing power. This interpretation is consistent with the recognised role of NADPH-generating dehydrogenases, including G6PDH, 6PGDH, and ICDH, in sustaining antioxidant systems and cellular redox homeostasis in plants (Corpas & Barroso, 2014; Mhamdi et al., 2010). By contrast, the two 6PGDH isoforms remained unchanged during the analysed stages (Figure 5D-E), indicating a comparatively stable proteomic contribution of this oxidative pentose phosphate pathway component. Therefore, rather than reflecting a generalised late increase in NADPH-producing enzymes, the data point to a developmental redistribution of redox support, with early NADPH-generating capacity preceding the late activation of glutathione-dependent antioxidant components. This redistribution is represented schematically by the early profiles of G6PDH and ICDH and the comparatively stable 6PGDH isoforms in the integrated redox model (Figure 8B-C).
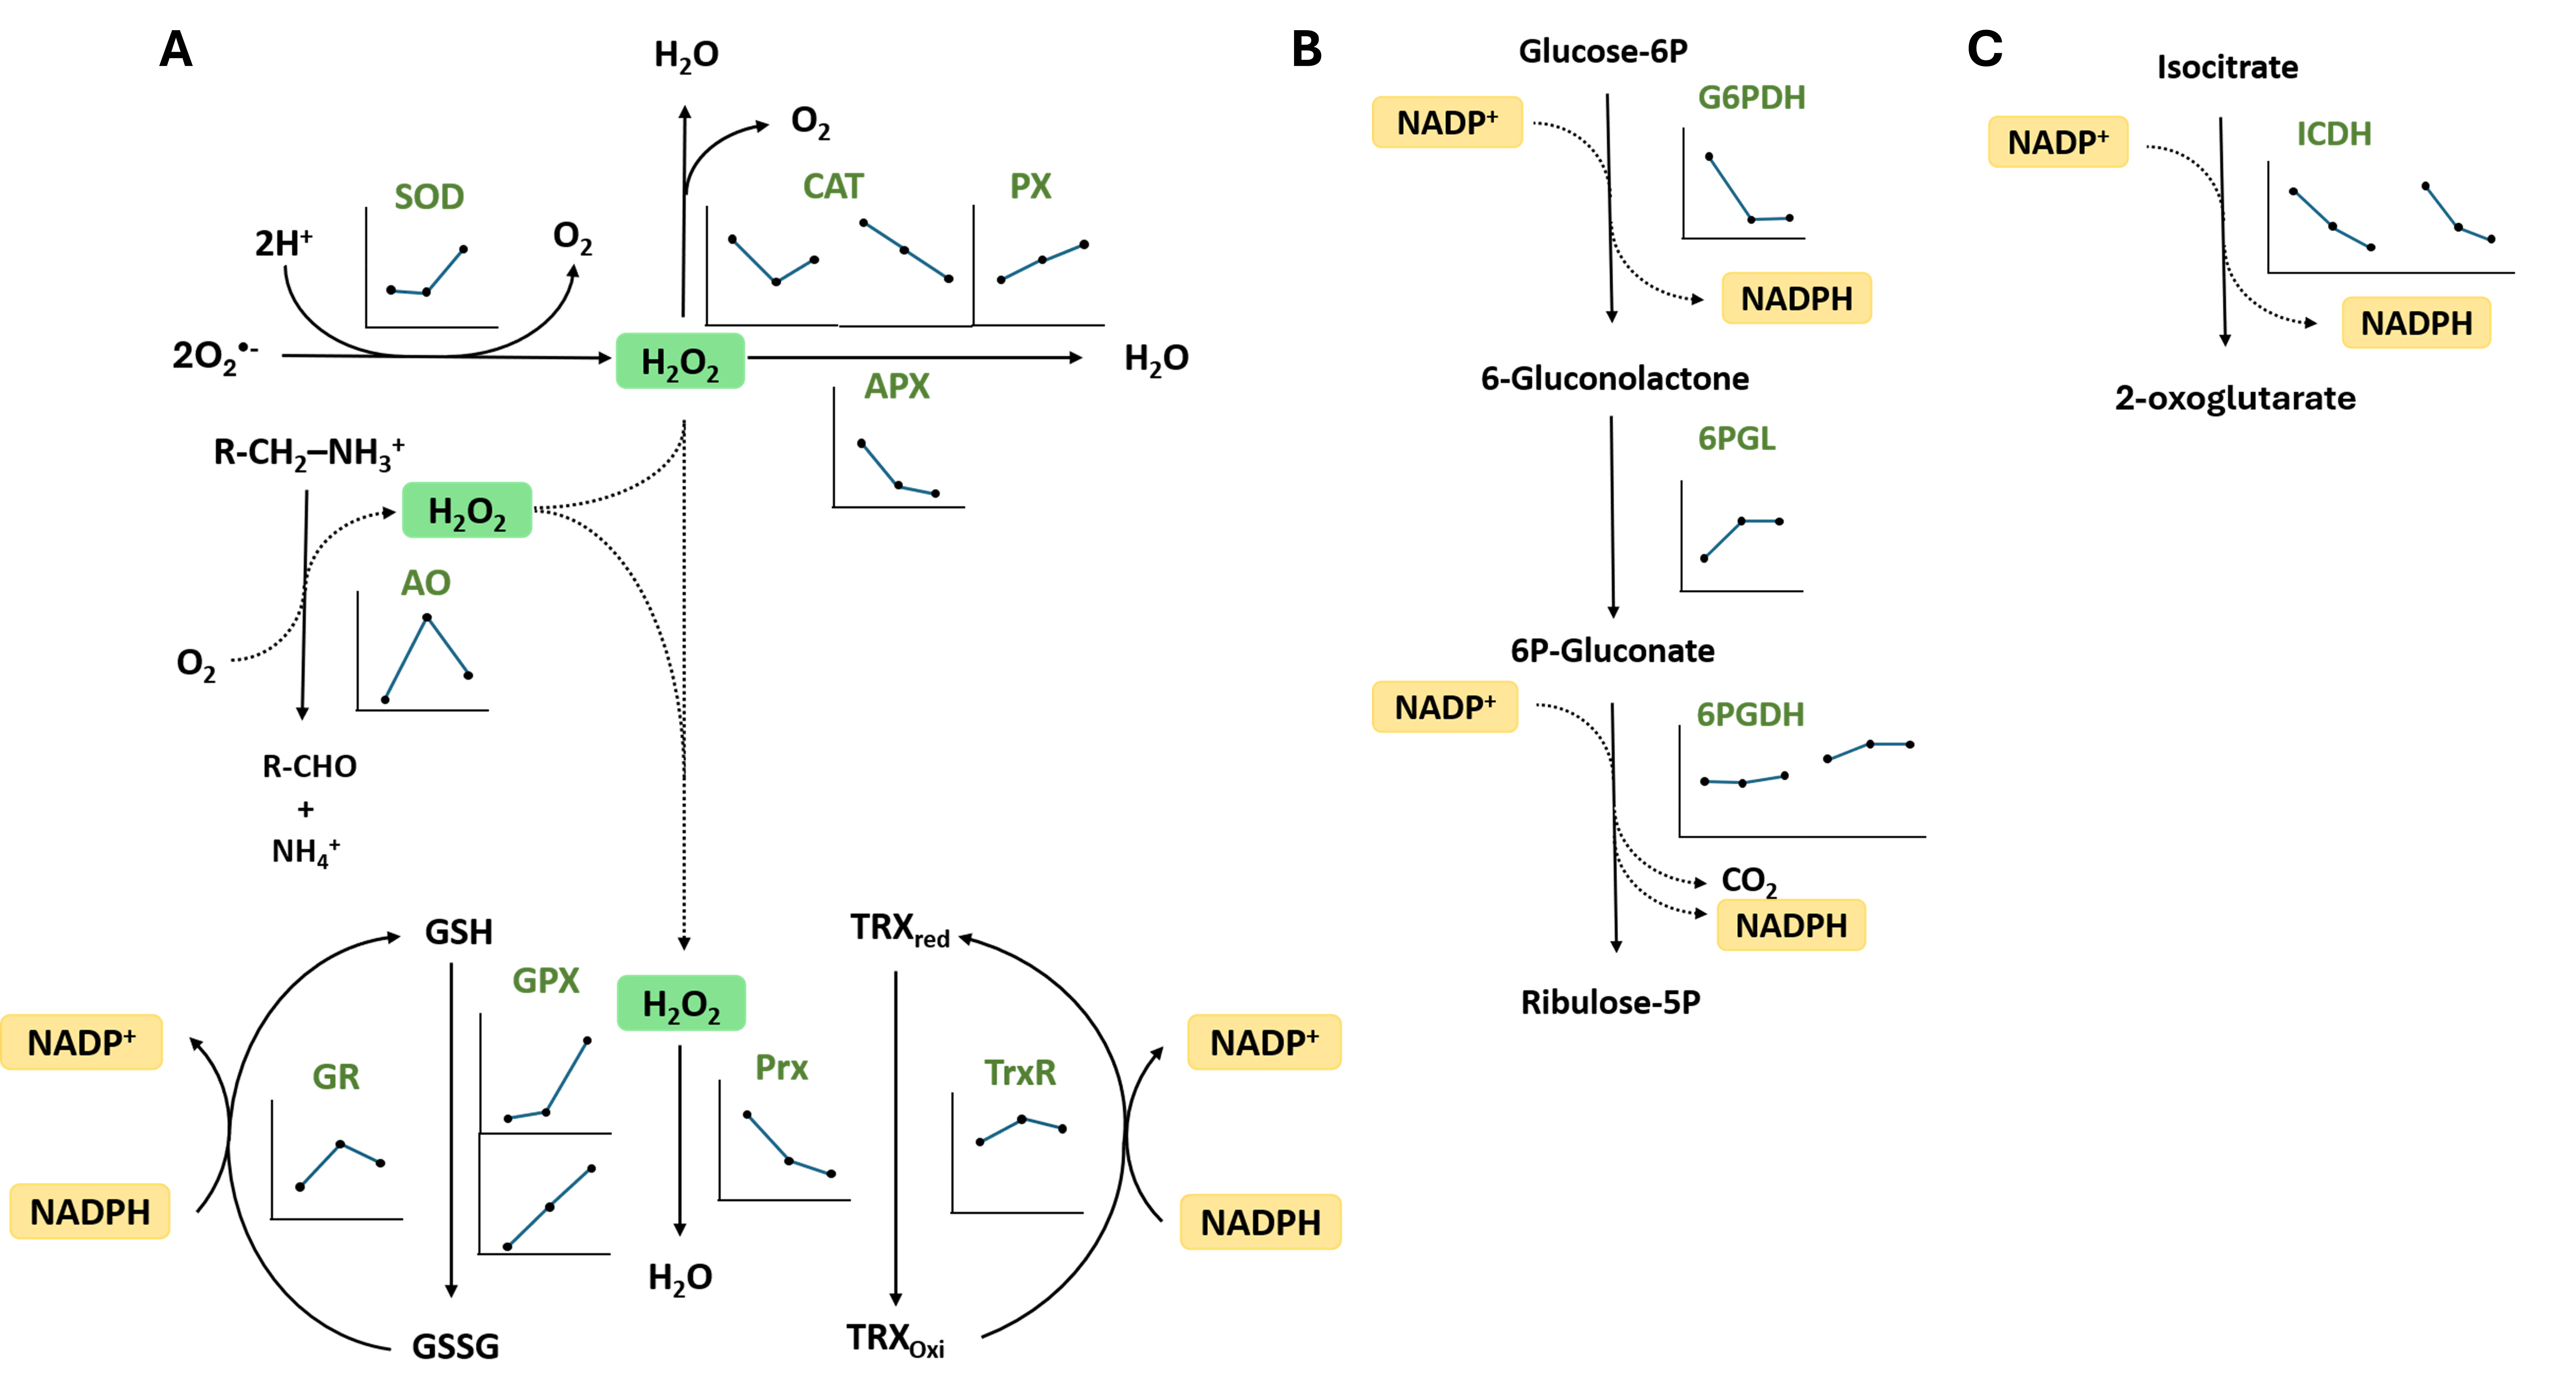
Figure 8. Integrated diagram of redox-related enzymes detected in Niagara Rosada berry mesocarp during ripening. Enzyme names are shown in green, and inset graphs represent the abundance profile of each detected isoform at EL 33, EL 35, and EL 39, respectively. A) enzymes involved in ROS production and scavenging, including superoxide dismutase (SOD), catalase (CAT), peroxidase (PX), ascorbate peroxidase (APX), amine oxidase (AO), glutathione peroxidase (GPX), peroxiredoxin (Prx), glutathione reductase (GR), and thioredoxin reductase (TrxR), B) enzymes associated with the oxidative pentose phosphate pathway, including glucose-6-phosphate dehydrogenase (G6PDH), 6-phosphogluconolactonase (6PGL) and 6-phosphogluconate dehydrogenase (6PGDH), and C) isocitrate dehydrogenase (ICDH), another NADPH-generating enzyme. EL 33 = berries still hard and green (pre-veraison), EL 35 = berries begin to colour and enlarge (veraison), and EL 39 = berries over-ripe.
GR abundance and activity followed distinct temporal profiles, indicating post-transcriptional or post-translational regulation of this glutathione-dependent component (Figure 4A-C). GR protein reached its highest abundance at EL 35, whereas enzymatic activity became detectable only at EL 39–EL 41. This late catalytic activation is consistent with an increased requirement for glutathione recycling as ROS-associated metabolism intensifies during the final stages of development (Dumanović et al., 2021; Foyer et al., 1997). In contrast, TrxR abundance remained steady throughout ripening (Figure 7A), indicating a constitutive function in sustaining thiol-disulphide equilibrium under stable metabolic conditions (Sevilla et al., 2015). The GPX and Prx (Figure 7B) pattern refined this balance as GPX isoforms (Figure 4D-E) became more abundant at later stages, whereas Prx predominates in early development. Despite more abundant, GPX catalytic activity decreased during maturation (Figure 4B). This regulation between GPX and Prx supports a shift from peroxide-processing routes as the berry matures, reinforcing the flexibility of the antioxidant network in meeting distinct metabolic demands throughout ripening (Figure 8A).
The data delineate a stage-dependent modulation of ROS generation and detoxification that maintains a controlled oxidative environment throughout ripening. Coordination among AO, PX, NADPH-generating dehydrogenases and antioxidant enzymes sustains redox balance, limiting oxidative injury while preserving the signalling capacity of H2O2 (Foyer & Noctor, 2011; Neill, 2002). Such regulation supports the interpretation that oxidative metabolism contributes to developmental progression rather than stress-related disruption. Within this controlled environment, redox homeostasis emerges as a key determinant of mesocarp functionality, consistent with the maintenance of tissue viability reported for ripening in grape berries (Caravia et al., 2015; Krasnow et al., 2008; Monteiro et al., 2025). This integrated organisation is summarised in Figure 8.
The integrated scheme summarises the main redox routes detected in Niagara Rosada mesocarp and highlights the temporal redistribution of antioxidant and NADPH-linked components during ripening (Figure 8). The enzymatic and proteomic profiles converge on a model in which early development is characterised by higher abundance or activity of selected peroxide-removing and NADPH-generating components, whereas late ripening involves increased SOD abundance/activity and the late activation of glutathione-dependent recycling. This organisation suggests that ROS metabolism is not uniformly intensified during ripening, but redistributed among enzymatic routes that combine peroxide detoxification, reducing-power supply and redox signalling.
For Niagara Rosada berries, softening is more consistent with regulated cell wall metabolism than with oxidative damage, in agreement with previous evidence that mesocarp vitality loss occurs independently of cell death (Monteiro et al., 2025). In the present study, the increase in MDA suggests ripening-associated lipid peroxidation, but not necessarily uncontrolled oxidative deterioration. Proteins involved in polysaccharide modification, such as pectin methylesterase, β-galactosidase, and expansins, may therefore operate within a controlled redox framework, enabling wall relaxation without generalised cellular collapse (Giovannoni et al., 2017; Lijavetzky et al., 2012). The persistence of aquaporins and membrane-associated proteins supports gradual turgor adjustment instead of structural failure (Caravia et al., 2015; Krasnow et al., 2008). Controlled ROS activity may further mediate local wall extensibility through peroxidase-driven crosslinking, associating redox signals with mechanical transitions in the mesocarp (Bolwell, 2002; De Gara, 2004).
Conclusion
The present findings indicate a developmental strategy in which oxidative control and structural remodelling are coordinated to sustain mesocarp functionality during ripening. This integrated regulation enables Niagara Rosada berries to attain full maturity while maintaining tissue organisation and mechanical stability, traits of great relevance to fruit quality and post-harvest performance.
Acknowledgements
Luan C. Corrêa is grateful for the scholarship by the Fundação de Amparo à Pesquisa do Estado do Rio de Janeiro (FAPERJ), Eduardo Monteiro is grateful for the scholarship funding provided by the Coordenação de Aperfeiçoamento de Pessoal de Nível Superior (CAPES), and Rodrigo R.R.F. Lucas is grateful for the scholarship by the Universidade Estadual do Norte Fluminense Darcy Ribeiro (UENF).
References
- Addy, S. K., & Goodman, R. N. (1973). Polyphenol oxidase and peroxidase activity in apple leaves inoculated with a virulent or an avirulent strain of Erwinia amylovora. Indian Phytopathology, 25(4), 575–579.
- Arnér, E. S. J., & Holmgren, A. (2000). Physiological functions of thioredoxin and thioredoxin reductase. European Journal of Biochemistry, 267(20), 6102–6109. https://doi.org/10.1046/j.1432-1327.2000.01701.x
- Barka, E. A. (2001). Protective enzymes against reactive oxygen species during ripening of tomato (Lycopersicon esculentum) fruits in response to low amounts of UV-C. Functional Plant Biology, 28(8), 785. https://doi.org/10.1071/PP00070
- Belenghi, B. (2004). Caspase-like activity in the seedlings of Pisum sativum eliminates weaker shoots during early vegetative development by induction of cell death. Journal of Experimental Botany, 55(398), 889–897. https://doi.org/10.1093/jxb/erh097
- Bhattacharjee, S. (2010). Sites of generation and physicochemical basis of formation of reactive oxygen species in plant cell. In S. Gupta (Ed.), Reactive Oxygen Species and Antioxidants in Higher Plants (pp. 1–30). Science Publishers. https://doi.org/10.1201/9781439854082-2
- Bindschedler, L. V., Dewdney, J., Blee, K. A., Stone, J. M., Asai, T., Plotnikov, J., Denoux, C., Hayes, T., Gerrish, C., Davies, D. R., Ausubel, F. M., & Paul Bolwell, G. (2006). Peroxidase‐dependent apoplastic oxidative burst in Arabidopsis required for pathogen resistance. The Plant Journal, 47(6), 851–863. https://doi.org/10.1111/j.1365-313X.2006.02837.x
- Birk, J., Ramming, T., Odermatt, A., & Appenzeller-Herzog, C. (2013). Green fluorescent protein-based monitoring of endoplasmic reticulum redox poise. Frontiers in Genetics, 4, 108. https://doi.org/10.3389/fgene.2013.00108
- Bolwell, G. P. (2002). The apoplastic oxidative burst in response to biotic stress in plants: A three-component system. Journal of Experimental Botany, 53(372), 1367–1376. https://doi.org/10.1093/jexbot/53.372.1367
- Buege, J. A., & Aust, S. D. (1978). [30] Microsomal lipid peroxidation. In Methods in Enzymology (Vol. 52, pp. 302–310). Elsevier. https://doi.org/10.1016/S0076-6879(78)52032-6
- Caravia, L., Collins, C., & Tyerman, S. D. (2015). Electrical impedance of Shiraz berries correlates with decreasing cell vitality during ripening: Impedance of Shiraz berries and cell vitality. Australian Journal of Grape and Wine Research, 21(3), 430–438. https://doi.org/10.1111/ajgw.12157
- Chan, Z., Yokawa, K., Kim, W.-Y., & Song, C.-P. (2016). ROS Regulation during Plant Abiotic Stress Responses. Frontiers in Plant Science, 7, 1536. https://doi.org/10.3389/fpls.2016.01536
- Cona, A., Moreno, S., Cenci, F., Federico, R., & Angelini, R. (2005). Cellular re-distribution of flavin-containing polyamine oxidase in differentiating root and mesocotyl of Zea mays L. seedlings. Planta, 221(2), 265–276. https://doi.org/10.1007/s00425-004-1435-y
- Coombe, B. G. (1995). Growth Stages of the Grapevine: Adoption of a system for identifying grapevine growth stages. Australian Journal of Grape and Wine Research, 1(2), 104–110. https://doi.org/10.1111/j.1755-0238.1995.tb00086.x
- Corpas, F. J., Barroso, B. J., Sandalio, M. L., Distefano, S., Palma, M. J., Lupiáñez, J. A., & Del Río, A. L. (1998). A dehydrogenase-mediated recycling system of NADPH in plant peroxisomes. Biochemical Journal, 330(2), 777–784. https://doi.org/10.1042/bj3300777
- Corpas, F. J., & Barroso, J. B. (2014). NADPH-generating dehydrogenases: Their role in the mechanism of protection against nitro-oxidative stress induced by adverse environmental conditions. Frontiers in Environmental Science, 2, 55. https://doi.org/10.3389/fenvs.2014.00055
- Corpas, F. J., Barroso, J. B., & Del Rı́o, L. A. (2001). Peroxisomes as a source of reactive oxygen species and nitric oxide signal molecules in plant cells. Trends in Plant Science, 6(4), 145–150. https://doi.org/10.1016/S1360-1385(01)01898-2
- Corpas, F. J., Barroso, J. B., Sandalio, L. M., Palma, J. M., Lupiáñez, J. A., & Del Rı́o, L. A. (1999). Peroxisomal NADP-dependent isocitrate dehydrogenase. Characterization and activity regulation during natural senescence. Plant Physiology, 121(3), 921–928. https://doi.org/10.1104/pp.121.3.921
- Dąbrowska, G., Kata, A., Goc, A., Szechynska-Hebda, M., & Skrzypek, E. (2007). Characteristics of the plant ascorbate peroxidase family. Acta Biologica Cracoviensia, Series Botanica, 49(1), 7–17.
- Da Paschoa, R. P., Xavier, L. R., Corrêa, C. C. G., Vieira, K. D. S., Pacheco, D. D. R., Gomes, L. D. E. S., Da Silva, C. E. A., Alves, L. E. D. O., Pinto, V. B., Santa-Catarina, C., & Silveira, V. (2026). Early regulatory networks driving somatic embryogenesis in Saccharum spp. L. revealed by time-resolved proteomics. Journal of Proteomics, 326, 105602. https://doi.org/10.1016/j.jprot.2026.105602
- De Gara, L. (2004). Class III peroxidases and ascorbate metabolism in plants. Phytochemistry Reviews, 3(1–2), 195–205. https://doi.org/10.1023/B:PHYT.0000047795.82713.99
- Deutsch, E. W., Bandeira, N., Perez-Riverol, Y., Sharma, V., Carver, J. J., Mendoza, L., Kundu, D. J., Wang, S., Bandla, C., Kamatchinathan, S., Hewapathirana, S., Pullman, B. S., Wertz, J., Sun, Z., Kawano, S., Okuda, S., Watanabe, Y., MacLean, B., MacCoss, M. J., … Vizcaíno, J. A. (2023). The ProteomeXchange consortium at 10 years: 2023 update. Nucleic Acids Research, 51(D1), D1539–D1548. https://doi.org/10.1093/nar/gkac1040
- Dhindsa, R. S., Plumb-Dhindsa, P., & Thorpe, T. A. (1981). Leaf Senescence: Correlated with increased levels of membrane permeability and lipid peroxidation, and decreased levels of superoxide dismutase and catalase. Journal of Experimental Botany, 32(1), 93–101. https://doi.org/10.1093/jxb/32.1.93
- Dumanović, J., Nepovimova, E., Natić, M., Kuča, K., & Jaćević, V. (2021). The significance of reactive oxygen species and antioxidant defense system in plants: A concise overview. Frontiers in Plant Science, 11, 552969. https://doi.org/10.3389/fpls.2020.552969
- Fiske, C. H., & Subbarow, Y. (1925). The colorimetric determination of phosphorus. Journal of Biological Chemistry, 66(2), 375–400. https://doi.org/10.1016/S0021-9258(18)84756-1
- Foyer, C. H., Lopez‐Delgado, H., Dat, J. F., & Scott, I. M. (1997). Hydrogen peroxide‐ and glutathione‐associated mechanisms of acclimatory stress tolerance and signalling. Physiologia Plantarum, 100(2), 241–254. https://doi.org/10.1111/j.1399-3054.1997.tb04780.x
- Foyer, C. H., & Noctor, G. (2011). Ascorbate and glutathione: The heart of the redox hub. Plant Physiology, 155(1), 2–18. https://doi.org/10.1104/pp.110.167569
- Giovannoni, J., Nguyen, C., Ampofo, B., Zhong, S., & Fei, Z. (2017). The epigenome and transcriptional dynamics of fruit ripening. Annual Review of Plant Biology, 68(1), 61–84. https://doi.org/10.1146/annurev-arplant-042916-040906
- Gupta, S. D. (Ed.1). (2010). Oxidative burst-mediated ROS signaling pathways regulating tuberization in potato. In Reactive Oxygen Species and Antioxidants in Higher Plants (1 edn, pp. 95–116). CRC Press. https://doi.org/10.1201/9781439854082-9
- Halliwell, B., & Gutteridge, J. M. C. (2015). Free radicals in biology and medicine (Fifth edition). Oxford University Press. https://doi.org/10.1093/acprof:oso/9780198717478.001.0001
- Heath, R. L., & Packer, L. (1968). Photoperoxidation in isolated chloroplasts. Archives of Biochemistry and Biophysics, 125(1), 189–198. https://doi.org/10.1016/0003-9861(68)90654-1
- Huan, C., Jiang, L., An, X., Yu, M., Xu, Y., Ma, R., & Yu, Z. (2016). Potential role of reactive oxygen species and antioxidant genes in the regulation of peach fruit development and ripening. Plant Physiology and Biochemistry, 104, 294–303. https://doi.org/10.1016/j.plaphy.2016.05.013
- Imlay, J. A. (2003). Pathways of oxidative damage. Annual Review of Microbiology, 57(1), 395–418. https://doi.org/10.1146/annurev.micro.57.030502.090938
- Jimenez, A., Hernandez, J. A., Del Rio, L. A., & Sevilla, F. (1997). Evidence for the presence of the ascorbate-glutathione cycle in mitochondria and peroxisomes of pea leaves. Plant Physiology, 114(1), 275–284. https://doi.org/10.1104/pp.114.1.275
- Krasnow, M., Matthews, M., & Shackel, K. (2008). Evidence for substantial maintenance of membrane integrity and cell viability in normally developing grape (Vitis vinifera L.) berries throughout development. Journal of Experimental Botany, 59(4), 849–859. https://doi.org/10.1093/jxb/erm372
- Lijavetzky, D., Carbonell-Bejerano, P., Grimplet, J., Bravo, G., Flores, P., Fenoll, J., Hellín, P., Oliveros, J. C., & Martínez-Zapater, J. M. (2012). Berry flesh and skin ripening features in Vitis vinifera as assessed by transcriptional profiling. PLOS ONE, 7(6), e39547. https://doi.org/10.1371/journal.pone.0039547
- Lu, L., Delrot, S., & Liang, Z. (2024). From acidity to sweetness: A comprehensive review of carbon accumulation in grape berries. Molecular Horticulture, 4(1), 22. https://doi.org/10.1186/s43897-024-00100-8
- Mhamdi, A., Mauve, C., Houda, G., Saindrenan, P., Hodges, M., & Noctor, G. (2010). Cytosolic NADP-dependent isocitrate dehydrogenase contributes to redox homeostasis and the regulation of pathogen responses in Arabidopsis leaves. Plant, Cell & Environment, 33(7), 1112-1123. https://doi.org/10.1111/j.1365-3040.2010.02133.x
- Mittler, R. (2002). Oxidative stress, antioxidants and stress tolerance. Trends in Plant Science, 7(9), 405–410. https://doi.org/10.1016/S1360-1385(02)02312-9
- Møller, I. M. (2001). Plant mitochondria and oxidative stress: Electron transport, NADPH turnover, and metabolism of reactive oxygen species. Annual Review of Plant Physiology and Plant Molecular Biology, 52(1), 561–591. https://doi.org/10.1146/annurev.arplant.52.1.561
- Møller, S. G., & McPherson, M. J. (1998). Developmental expression and biochemical analysis of the Arabidopsis atao1 gene encoding an H2O2‐generating diamine oxidase. The Plant Journal, 13(6), 781–791. https://doi.org/10.1046/j.1365-313X.1998.00080.x
- Monteiro, E., Corrêa, L. C., Da Paschoa, R. P., Lucas, R. R. R. F., Da Rocha, L. O., Silveira, V., & Bressan-Smith, R. (2025). Premature mesocarp vitality loss in Niagara Rosada occurs independently of cell death. ACS Agricultural Science & Technology, 5(11), 2119–2131. https://doi.org/10.1021/acsagscitech.5c00280
- Nanjo, Y., Skultety, L., Uváčková, L., Klubicová, K., Hajduch, M., & Komatsu, S. (2012). Mass spectrometry-based analysis of proteomic changes in the root tips of flooded soybean seedlings. Journal of Proteome Research, 11(1), 372–385. https://doi.org/10.1021/pr200701y
- Neill, S. (2002). Hydrogen peroxide signalling. Current Opinion in Plant Biology, 5(5), 388–395. https://doi.org/10.1016/S1369-5266(02)00282-0
- Ogilby, P. R. (2010). Singlet oxygen: There is indeed something new under the sun. Chemical Society Reviews, 39(8), 3181. https://doi.org/10.1039/b926014p
- Pérez, F. J., Noriega, X., & Rubio, S. (2021). Hydrogen peroxide increases during endodormancy and decreases during budbreak in grapevine (Vitis vinifera L.) buds. Antioxidants, 10(6), 873. https://doi.org/10.3390/antiox10060873
- Perez-Riverol, Y., Bai, J., Bandla, C., García-Seisdedos, D., Hewapathirana, S., Kamatchinathan, S., Kundu, D. J., Prakash, A., Frericks-Zipper, A., Eisenacher, M., Walzer, M., Wang, S., Brazma, A., & Vizcaíno, J. A. (2022). The PRIDE database resources in 2022: A hub for mass spectrometry-based proteomics evidences. Nucleic Acids Research, 50(D1), D543–D552. https://doi.org/10.1093/nar/gkab1038
- Pierozzi, N. I., & Moura, M. F. (2014). Cytological analyses in ‘Niagara Branca’ grape and in its somatic mutant ‘Niagara Rosada’. Notulae Botanicae Horti Agrobotanici Cluj-Napoca, 42(2), 460–465. https://doi.org/10.15835/nbha.42.2.9540
- Pilati, S., Brazzale, D., Guella, G., Milli, A., Ruberti, C., Biasioli, F., Zottini, M., & Moser, C. (2014). The onset of grapevine berry ripening is characterized by ROS accumulation and lipoxygenase-mediated membrane peroxidation in the skin. BMC Plant Biology, 14(1), 87. https://doi.org/10.1186/1471-2229-14-87
- Rani, P., Unni, K. M., & Karthikeyan, J. (2004). Evaluation of antioxidant properties of berries. Indian Journal of Clinical Biochemistry, 19(2), 103–110. https://doi.org/10.1007/BF02894266
- Rao, M. V., Paliyath, G., & Ormrod, D. P. (1996). Ultraviolet-B- and ozone-induced biochemical changes in antioxidant enzymes of Arabidopsis thaliana. Plant Physiology, 110(1), 125–136. https://doi.org/10.1104/pp.110.1.125
- Reis, R. S., Vale, E. M., Sousa, K. R., Santa-Catarina, C., & Silveira, V. (2021). Pretreatment free of 2,4-dichlorophenoxyacetic acid improves the differentiation of sugarcane somatic embryos by affecting the hormonal balance and the accumulation of reserves. Plant Cell, Tissue and Organ Culture (PCTOC), 145(1), 101–115. https://doi.org/10.1007/s11240-020-01995-z
- Rhee, S. G., & Woo, H. A. (2011). Multiple functions of peroxiredoxins: Peroxidases, sensors and regulators of the intracellular messenger H2O2, and protein chaperones. Antioxidants & Redox Signaling, 15(3), 781–794. https://doi.org/10.1089/ars.2010.3393
- Romieu, C., Tesniere, C., Than-Ham, L., Flanzy, C., & Robin, J.-P. (1992). An examination of the importance of anaerobiosis and ethanol in causing injury to grape mitochondria. American Journal of Enology and Viticulture, 43(2), 129–133. https://doi.org/10.5344/ajev.1992.43.2.129
- Rotruck, J. T., Pope, A. L., Ganther, H. E., Swanson, A. B., Hafeman, D. G., & Hoekstra, W. G. (1973). Selenium: Biochemical role as a component of glutathione peroxidase. Science, 179(4073), 588–590. https://doi.org/10.1126/science.179.4073.588
- Sevilla, F., Camejo, D., Ortiz-Espín, A., Calderón, A., Lázaro, J. J., & Jiménez, A. (2015). The thioredoxin/peroxiredoxin/sulfiredoxin system: Current overview on its redox function in plants and regulation by reactive oxygen and nitrogen species. Journal of Experimental Botany, 66(10), 2945–2955. https://doi.org/10.1093/jxb/erv146
- Sinha, A. K. (1972). Colorimetric assay of catalase. Analytical Biochemistry, 47(2), 389–394. https://doi.org/10.1016/0003-2697(72)90132-7
- Suzuki, N., Miller, G., Morales, J., Shulaev, V., Torres, M. A., & Mittler, R. (2011). Respiratory burst oxidases: The engines of ROS signaling. Current Opinion in Plant Biology, 14(6), 691–699. https://doi.org/10.1016/j.pbi.2011.07.014
- Torres, M. A., Dangl, J. L., & Jones, J. D. G. (2002). Arabidopsis gp91phox homologues AtrbohD and AtrbohF are required for accumulation of reactive oxygen intermediates in the plant defense response. Proceedings of the National Academy of Sciences, 99(1), 517–522. https://doi.org/10.1073/pnas.012452499
- Van Breusegem, F., Vranová, E., Dat, J. F., & Inzé, D. (2001). The role of active oxygen species in plant signal transduction. Plant Science, 161(3), 405–414. https://doi.org/10.1016/S0168-9452(01)00452-6
- Veal, E. A., Day, A. M., & Morgan, B. A. (2007). Hydrogen peroxide sensing and signaling. Molecular Cell, 26(1), 1–14. https://doi.org/10.1016/j.molcel.2007.03.016
- Wang, K., Wu, D., Bo, Z., Chen, S., Wang, Z., Zheng, Y., & Fang, Y. (2019). Regulation of redox status contributes to priming defense against Botrytis cinerea in grape berries treated with β-aminobutyric acid. Scientia Horticulturae, 244, 352–364. https://doi.org/10.1016/j.scienta.2018.09.074
- Xiao, Z., Liao, S., Rogiers, S. Y., Sadras, V. O., & Tyerman, S. D. (2018a). Effect of water stress and elevated temperature on hypoxia and cell death in the mesocarp of Shiraz berries. Australian Journal of Grape and Wine Research, 24(4), 487–497. https://doi.org/10.1111/ajgw.12363
- Xiao, Z., Rogiers, S. Y., Sadras, V. O., & Tyerman, S. D. (2018b). Hypoxia in grape berries: The role of seed respiration and lenticels on the berry pedicel and the possible link to cell death. Journal of Experimental Botany, 69(8), 2071–2083. https://doi.org/10.1093/jxb/ery039
- Zeng, K., Deng, Y., Ming, J., & Deng, L. (2010). Induction of disease resistance and ROS metabolism in navel oranges by chitosan. Scientia Horticulturae, 126(2), 223–228. https://doi.org/10.1016/j.scienta.2010.07.017
 Views: 534
 XML: 74