

VITICULTURE / Original research article
Abstract
Primary infection by Plasmopara viticola, the causal agent of grapevine downy mildew, is a critical event in viticulture, marking the onset of fungicide applications to protect grape production. This infection originates from the overwintering of oospores in vineyard soil and their maturation and germination under specific conditions. In Switzerland, the VitiMeteo-Plasmopara forecasting model is employed to calculate primary infection risk after the stage prediction of oospore maturity, when the sum of temperature degree-day (TDD, base 8 °C) from January 1 reaches a threshold of 140 °C. We conducted systematic oospore germination observations over three consecutive seasons (2022–2024) in Changins, Switzerland, complemented by a full dataset spanning 2004–2024, to identify the key climatic drivers of oospore maturity. Pearson correlation analysis identified strong positive associations between oospore minimal time of germination (MTG) and temperature-related variables (TDD, mean temperature, and vapour pressure deficit), while rainfall- and humidity-related variables (cumulative precipitation and the number of rainy days in the preceding 30 days) were negatively correlated with MTG. A principal component analysis confirmed this pattern, showing that mature oospores were more frequently associated with cooler, wetter conditions, whereas immature oospores occurred under warmer, drier conditions. Furthermore, BBCH stage 13 (three unfolded leaves) marked a clear shift in climatic drivers. Before BBCH 13, hydric variables and TDD were the main factors associated with shorter MTG. From BBCH 13 onward, TDD, mean temperature, and vapour pressure deficit became positively correlated with MTG, reflecting a longer germination time, thereby suggesting a shift in the pathogen’s germination dynamics. Based on pre-BBCH 13 drivers, we developed a generalised linear model that integrates cumulative precipitation beginning on January 1, the number of rainy days in the preceding 30 days, and TDD. Applied over 2004–2025, with a maturity threshold of MTG < 1.5 days, this generalised linear model produced maturity dates that were closely aligned with observed primary infections. When integrated into VitiMeteo-Plasmopara, it increased the proportion of correctly timed primary infection predictions from 75% to 85% over 20 years, corresponding to a 40% reduction in delayed forecasts, thereby supporting more precise fungicide timing and reducing unnecessary treatments.
Introduction
Grapevine downy mildew, caused by the oomycete Plasmopara viticola (Berk. & M. A. Curtis) Berl. & De Toni (1888) represents one of the main phytosanitary threats to viticulture worldwide. The disease causes both qualitative and quantitative losses in grape production. Under favourable climatic conditions, P. viticola epidemics can destroy 40–90 % of plant organs in the field (Toffolatti et al., 2018). During the growing season, the pathogen can spread rapidly because of its multiple cycles of sporulation. These epidemic cycles include primary infection, initiated by overwintering oospores in soil, and secondary infections, driven by sporangia produced on infected tissues. Although both infection cycles occur during the growing season, they differ in their biological origin, climatic drivers, and relevance for disease management. Primary infection determines the onset of the epidemic and is therefore critical for the timing of the first fungicide application, whereas secondary infections are responsible for epidemic development and disease amplification once the pathogen is established (Gessler et al., 2011). The pathogen produces sporangia that release biflagellate zoospores, which swim in free water to reach stomata on all green grapevine tissues, including leaves, inflorescences, fruit clusters, and young bunches, where they penetrate plant tissue (Peng et al., 2024). Due to its strong epidemic potential, preventive fungicide applications before rainfall events are essential for preventing the dissemination of the disease.
The sexual phase of the pathogen occurs at the end of the season, requiring the encounter of two mating types, P1 and P2 (Wong et al., 2001). At this stage, oospores are formed within lesions on infected leaves. As the leaves senesce and fall to the ground, oospores are released into the vineyard soil. Oospores, measuring between 20 and 100 µm in diameter and surrounded by a thick wall (1–5 µm; Vercesi et al., 1999), enable the pathogen to survive winter conditions and remain viable for several years (Burkardt & Hill, 1997). In spring, once environmental conditions become favourable, mature P. viticola oospores germinate into a primary macrosporangium that produces zoospores. These are dispersed by splashing onto the green parts of the plant, where they initiate primary infections (Rossi & Caffi, 2012). This first infection event is a key moment in the epidemic. Controlling this initial infection limits the early development of the disease in the plot and helps delay or reduce subsequent secondary cycles.
The strategic importance of P. viticola primary infection has prompted extensive research on the overwintering, maturation, and germination of oospores. Here, oospore maturation refers to the physiological process of acquiring germination capacity to germinate under favourable conditions, whereas germination corresponds to the observed emergence of a macrosporangium from a mature oospore under such conditions. Early studies that explored the role of temperature showed that oospores kept for several months at a constant temperature between −5 °C and 25 °C do not germinate, suggesting that fluctuations are required to break dormancy (Weber, 1986). Maturation begins when the average daily temperature exceeds 8 °C (Gehmann et al., 1987), implying that low temperatures in spring can delay maturation (Rouzet & Jacquin, 2003). In Canada, dormancy release of the oospores requires an accumulation of 160 °C days (base 8 °C since 1 January), and germination occurs only when temperatures fall within the 11–30 °C range over a 2–3 month period (Carisse, 2016).
Precipitation and relative humidity also play crucial roles. According to Hill and Bleyer (2000), oospores overwintering in watertight shelters never mature, and an interruption of contact with liquid water for more than 30 days blocks germination. High humidity strongly promotes germination: 95 % was achieved after 9 h at a vapour pressure deficit (VPD) of 0.2 kPa, compared with only 5 % at VPD = 8.2 kPa (Hill, 2001). Free water is also decisive, with minimum thresholds estimated at 8 mm of rainfall per day (Gilles, 2004) or 10 mm per day (Martínez-Bracero et al., 2020) to allow germination. Importantly, continuous moisture appears to be required not only for germination but also for maturation. Rossi et al. (2002) found that maturation of P. viticola stopped when total rainfall remained below 5 mm over three weeks, followed by a restart as soon as the rain returned. Caffi and Rossi (2006) further identified a litter moisture requirement of more than 40 % to allow maturation. Once mature, oospores can germinate even under suboptimal conditions, although the process is slowed. Controlled temperatures as low as 13 °C or as high as 32 °C do not prevent germination of P. viticola but extend its duration (Serra & Borgo, 1995; Hill & Bleyer, 2000; Maddalena et al., 2021).
To interpret these observed dynamics, Rozon-Tran Manh Sung and Clerjeau (1988) proposed the “double-programmed time bomb” theory. According to this hypothesis, oospore maturation is triggered by autumn precipitation, whereas germination is regulated independently and is primarily stimulated by spring rainfall. This temporal dissociation enables the pathogen to synchronise its life cycle with seasonal environmental conditions. More recently, Maddalena et al. (2021) highlighted a synchronisation between oospore maturity and grapevine phenology. Maturity is reached before the end of the plant’s dormancy, and then germination accelerates with bud break (BBCH = 11). The authors also indicated a positive correlation between germination rate, average temperature, and cumulative precipitation over the 40–60 days prior to sampling.
Although previous studies agree that temperature, rainfall, and moisture availability influence oospore maturation and germination (Caffi & Rossi, 2006; Gehmann et al., 1987; Hill & Bleyer, 2000; Maddalena et al., 2021; Rossi et al., 2002), the specific threshold values reported vary considerably. This variability is largely due to differences in experimental design, particularly in the methods used to simulate overwintering conditions. Two main approaches are commonly employed to recover grapevine leaf fragments containing oospores: nylon mesh bags placed on the soil surface and buried plastic containers. The nylon mesh bags method involves placing grapevine leaf fragments with oospores into porous nylon bags. These are then laid directly on the soil surface within the vineyard, where they remain exposed to natural environmental fluctuations (temperature, rainfall, solar radiation, and wind). The mesh allows for free air and moisture exchange, mimicking surface litter conditions. By contrast, buried plastic containers (such as conical centrifuge tubes or plastic bottles modified to permit water exchange) are filled with a mixture of sand and soil into which infected leaf fragments are placed. These containers are buried in the vineyard soil to simulate subsurface overwintering. This approach reduces experimental variability and better reflects the thermal and moisture buffering capacity of the soil. In a comparative study, Cortesi and Zerbetto (1994) demonstrated that oospores overwintered in buried containers exhibited earlier, more synchronous, and consistent germination. By contrast, the oospores placed in surface bags showed delayed, more erratic germination patterns distributed over a longer period. These methodological differences underscore the importance of standardising experimental conditions when assessing oospore behaviour in response to environmental factors.
This diverse research has contributed to the development of prediction models that act as decision-support tools to help winegrowers anticipate the timing of fungicide applications. The oldest model, proposed by Baldacci (1947), is based on the “3-10 rule”: a temperature above 10 °C, vine shoots longer than 10 cm, and rainfall of more than 10 mm in 24–48 h. The French Potentiel Système model (Strizyk, 1983) compares the cumulative temperature and precipitation between 1 October and 31 March with the averages for the previous 30 years. The American DMCast model (Park et al., 1997), based on the work of Rozon-Tran Manh Sung and Clerjeau (1987), estimates the date of the primary infection by considering that it occurs when 3 % of oospores are ready to germinate, based on germination curves established at 20 °C in the laboratory. The SIMPO model (Hill, 2000), developed in Germany, considers temperature, relative humidity, and daily rainfall exceeding 5 mm. In Italy, the UCSC model (Rossi et al., 2005) integrates hourly parameters of temperature, humidity, precipitation, and VPD and introduces an oospore maturation index to trigger the model only when the vine is receptive to infection. The collaborative Swiss-German VitiMeteo (VM)-Plasmopara model, developed by Siegfried et al. (2004), considers maturation to be reached when the temperature sum since 1 January reaches 140 °C days (base 8 °C). Germination of oospores is then triggered as soon as 5 mm of cumulative rainfall occurs within a 48-h period. Since 2000, observations conducted by Agroscope in Changins, Switzerland, have provided additional information on oospore maturity, complementing this model, which relies more on the phenological receptivity of the grapevine than on the actual physiological status of the oospores. These observations, carried out in the spring after each rainfall, inform Swiss winegrowers about the maturity of the oospores. However, despite these long-term observations, the physiological status of oospores is still represented in VM-Plasmopara by a fixed thermal threshold, while the relative contribution of hydric and phenology-related drivers to oospore maturation has not been quantitatively integrated. This gap limits the biological interpretation of the current maturity criterion and motivated the development of a climate-driven model to refine oospore maturity prediction.
The objective of the present study is to systematically monitor the germination of oospores at regular intervals during the early grapevine growing season (March to June) over three consecutive years (2022–2024), and to identify for the first time statistically significant associations between seasonal climatic variables and oospore maturity dates. This was done to better characterise the dynamics of maturation and germination under natural conditions. Cross-analysis of these observations with historical observations since 2004 and climatic data was conducted to identify the key environmental parameters driving both the end of dormancy and the initiation of germination. Ultimately, these results will allow for the refinement of the algorithms implemented in the VM-Plasmopara model, with the objective of improving the prediction of primary infections.
Materials and methods
1. Experimental site
The study was conducted at Agroscope’s “outdoor laboratory” in Changins, Switzerland (46°23'47.7" N, 6°13'54.0" E), a facility designed to study the primary infection of downy mildew. It consisted of three rows of five vines, each row planted with a different variety: Pinot noir, Gamay, and Chasselas. The vines were planted in 2005. The training system was Guyot, and one cane of each vine was bent to the ground to allow the leaves to grow very close to the soil and easily catch the zoospores released by the primary macrosporangia in spring. Since its establishment, no fungicides or insecticides had been applied. Herbicide applications were limited to glyphosate. In autumn, thousands of grapevine leaves showing downy mildew mosaic spots were collected from various commercial vineyards and laid on the ground of the outdoor laboratory, under a trellis, to accumulate large quantities of oospores in the soil. In this study, we also conducted weekly evaluations of the BBCH growth stages. Although the experimental plot included three cultivars, the analysis only considered the phenology of Chasselas, since the overwintering tubes used for the germination observations were placed under the Chasselas row.
2. Oospore collection
Infected grapevine leaves containing oospores were collected from different commercial vineyards (Changins, Yvorne, Leytron) between late September and early October, typically when morning temperatures dropped below 10 °C (Figure 1A). These vineyards were managed under either conventional or organic production systems, depending on the site and year. As oospores were visible under a stereomicroscope within light brown mosaic downy mildew lesions, thin leaves facilitated oospore visualisation by transparency. For example, young Chasselas leaves were particularly suitable. Accordingly, the leaf material used for the 2022−2024 systematic observations consisted predominantly of Chasselas leaves. As these young fresh leaves were collected in autumn, they were unlikely to have been directly exposed to fungicide applications. Freshly collected leaves were then stored for a few days at 4 °C in partially open plastic bags to prevent wilting before further processing.
(A) Young Chasselas leaf presenting mosaic downy mildew containing oospores; (B) Oospores (red arrows) observed on the abaxial leaf face under a stereomicroscope at 40 × magnification and bottom illumination. Scale bar = 0.1 mm; (C) Tube containing 25 leaf fragments full of oospores; (D) Tubes containing oospores inserted into the soil for overwintering, placed beneath the vine row between two grapevine plants.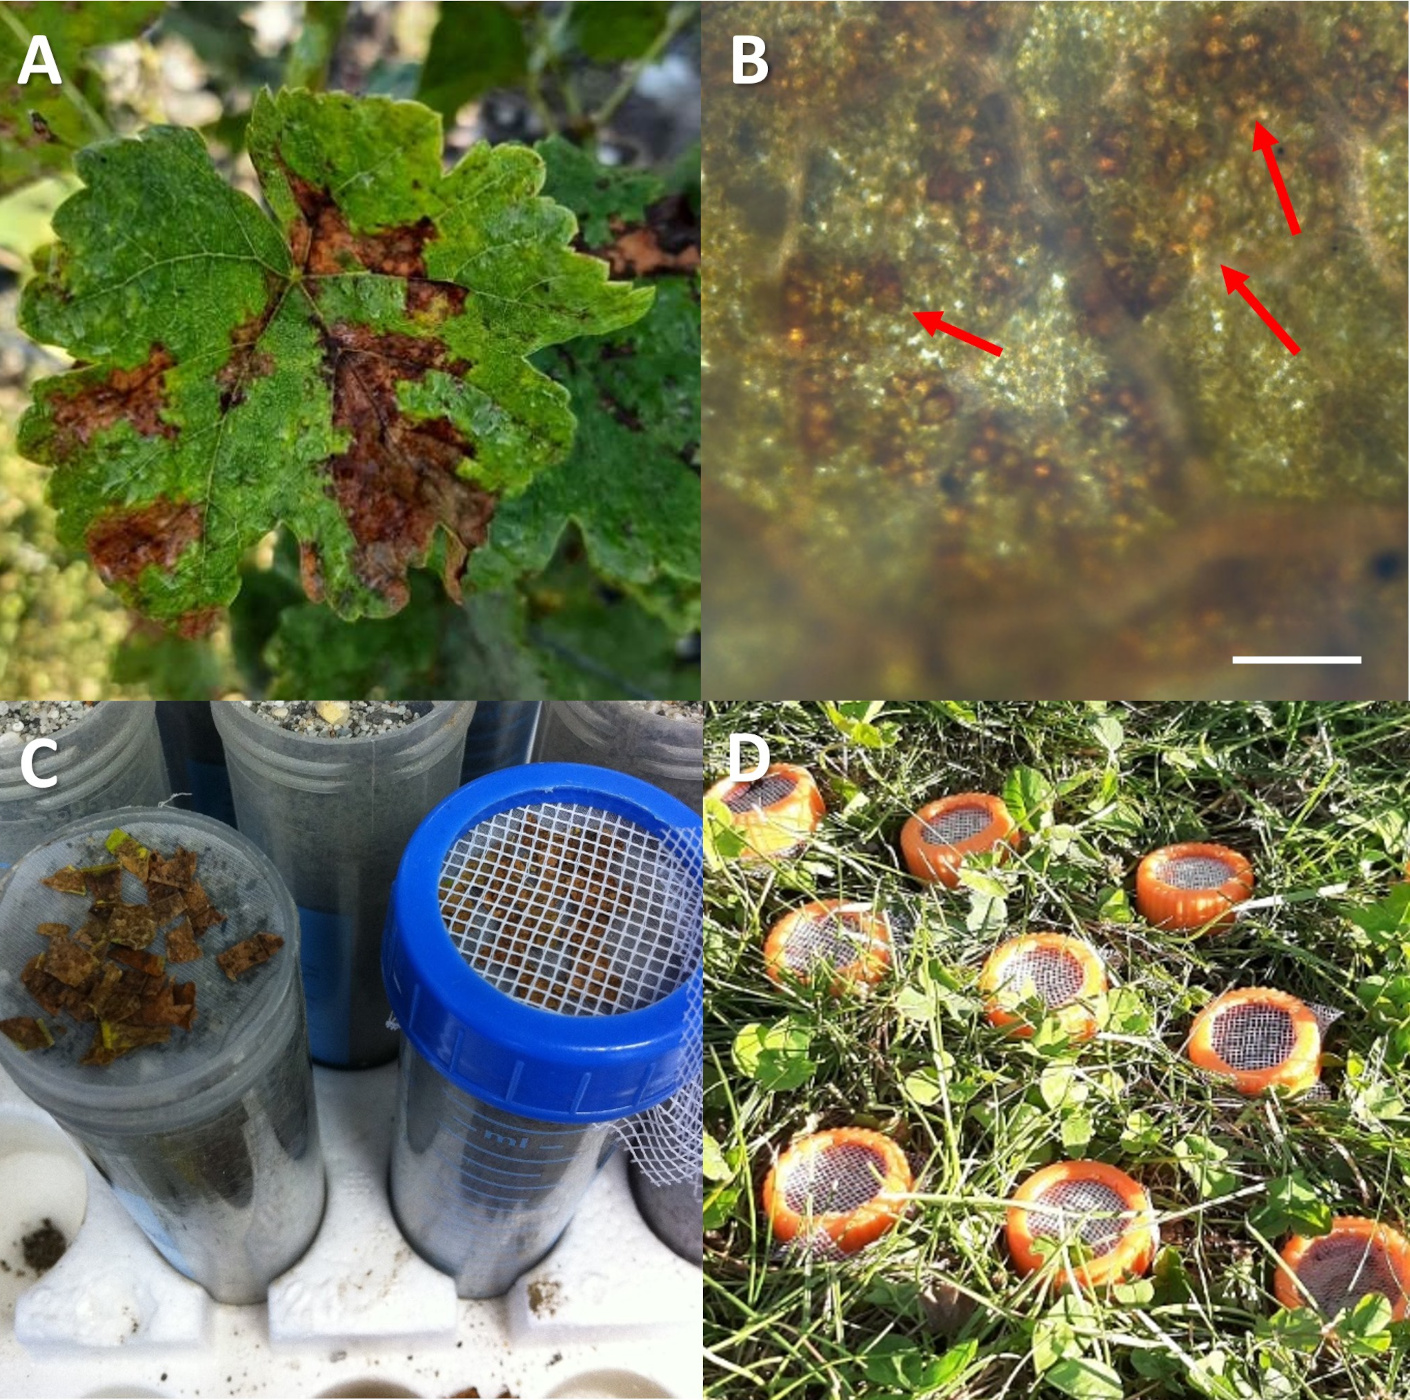
Figure 1. Preparation of oospores’ overwintering tubes.
3. Preparation of overwintering tubes
Soil conditions were replicated using 50 mL conical polypropylene centrifuge tubes (Corning, NY, Cat. no. 430290). The tubes were modified by drilling a 2.5 cm hole in the lid and cutting off the bottom centimetre of the conical end to allow water to flow through (Figure S1A and S1B). A metal mesh (1 mm × 1 mm mesh size), approximately 4 cm × 5 cm, was placed at the bottom of each tube to prevent soil fauna from entering (Figure S1C). The tubes were filled with lightly moistened potting soil and compacted up to the 45 mL mark. A layer of wet sand was then added on top to reproduce a well-aerated soil environment, maintaining moisture while preventing leaf debris from excessive decomposition (Figure S1D). Circular nylon mesh discs (3 cm in diameter, corresponding to the internal diameter of the tube opening; Figure S1E) were positioned on top of the wet sand to support the leaf fragments. An insect-proof net (also 1 mm × 1 mm mesh size), measuring 5 cm × 5 cm, covered the top of the tube and prevented insects and slugs from the surrounding vegetation from accessing the leaf fragments (Figure S1F). The tubes were stored at 4 °C until use to ensure adequate moisture retention.
The collected grapevine leaves (Figure S2A) were soaked in cold water prior to cleaning and cutting (Figure S2B). Each leaf was gently blotted with an absorbent cloth, and the lower leaf surface was lightly brushed using a toothbrush to remove debris (such as vegetal and fungal debris, dust, insects, etc.). The brown areas on the underside of the leaf, typically around the veins or edges, were examined under a stereomicroscope at 40 × magnification, with light coming from below, to identify oospores (Figure S2C). Oospores appeared as small, brown, clustered spherical bodies (Figure 1B and Figure S2D). A total of 25 fragments were excised with a scalpel from leaf areas containing locally dense oospore clusters. These clusters were identified visually under a stereomicroscope as areas where oospores were closely packed and often in contact with one another. The leaf fragments were placed onto the nylon mesh at the top of the tube, sealed, and stored at 4 °C (Figure 1C). No later than mid-October, all prepared tubes were inserted into the vineyard soil up to the cap level, positioned between grapevines, to replicate the climatic conditions experienced by the oospores in the soil (Figure 1D).
4. Observation of oospore germination
From mid-March to the end of June across three years (2022, 2023, 2024), one tube was removed from the experimental site soil once or twice a week to monitor oospore germination and generated 60 observations, of which 55 were retained after excluding series with fewer than 10 macrosporangia during the 10-day observation period. Historical oospore germination observations used in the full dataset from 2004 to 2021 were performed in the same way, but sampling was event-based rather than systematic, generally after rainfall events and until oospore maturity was reached. Across the 2004–2021 period, the number of retained observations ranged from 4 to 10 each year, with a mean of 6.67 observations per year. These historical observations contributed 120 retained observations, resulting in a full dataset of 175 observations for the 2004–2024 period.
For each observation, whether from the systematic 2022–2024 monitoring or from the historical dataset, one overwintering tube was processed using the same laboratory procedure. The 25 leaf fragments were placed into five 50-mm Petri dishes containing moistened filter paper to maintain high humidity (Figure 2A). Each fragment was then sliced into thin strips with a scalpel to facilitate microscopic observation and counting (Figure 2B). The Petri dishes were kept at room temperature and away from direct sunlight. For 10 consecutive days, each leaf fragment was carefully examined every 24 h under a stereomicroscope with top lighting at 40 × magnification to detect the presence of a macrosporangium (Figure 2C and 2D). Sporangia were counted and ruptured using a fine needle to avoid duplicate counts. The minimum time to germination (MTG) was quantified as the shortest incubation period required for the emergence of at least one macrosporangium. Because oospore physiological maturation could not be assessed directly, maturity was operationally defined as the earliest time point at which at least one oospore germinated within 24 h under laboratory conditions (saturated humidity and room temperature).
(A) Petri dishes containing five leaf fragments each on humid blotting paper; (B) Close-up of a cut leaf fragment; (C) and (D) Observation under a stereomicroscope (top illumination) of downy mildew macrosporangia indicated by red arrows, 40 × magnification. Scale bar = 0.1 mm.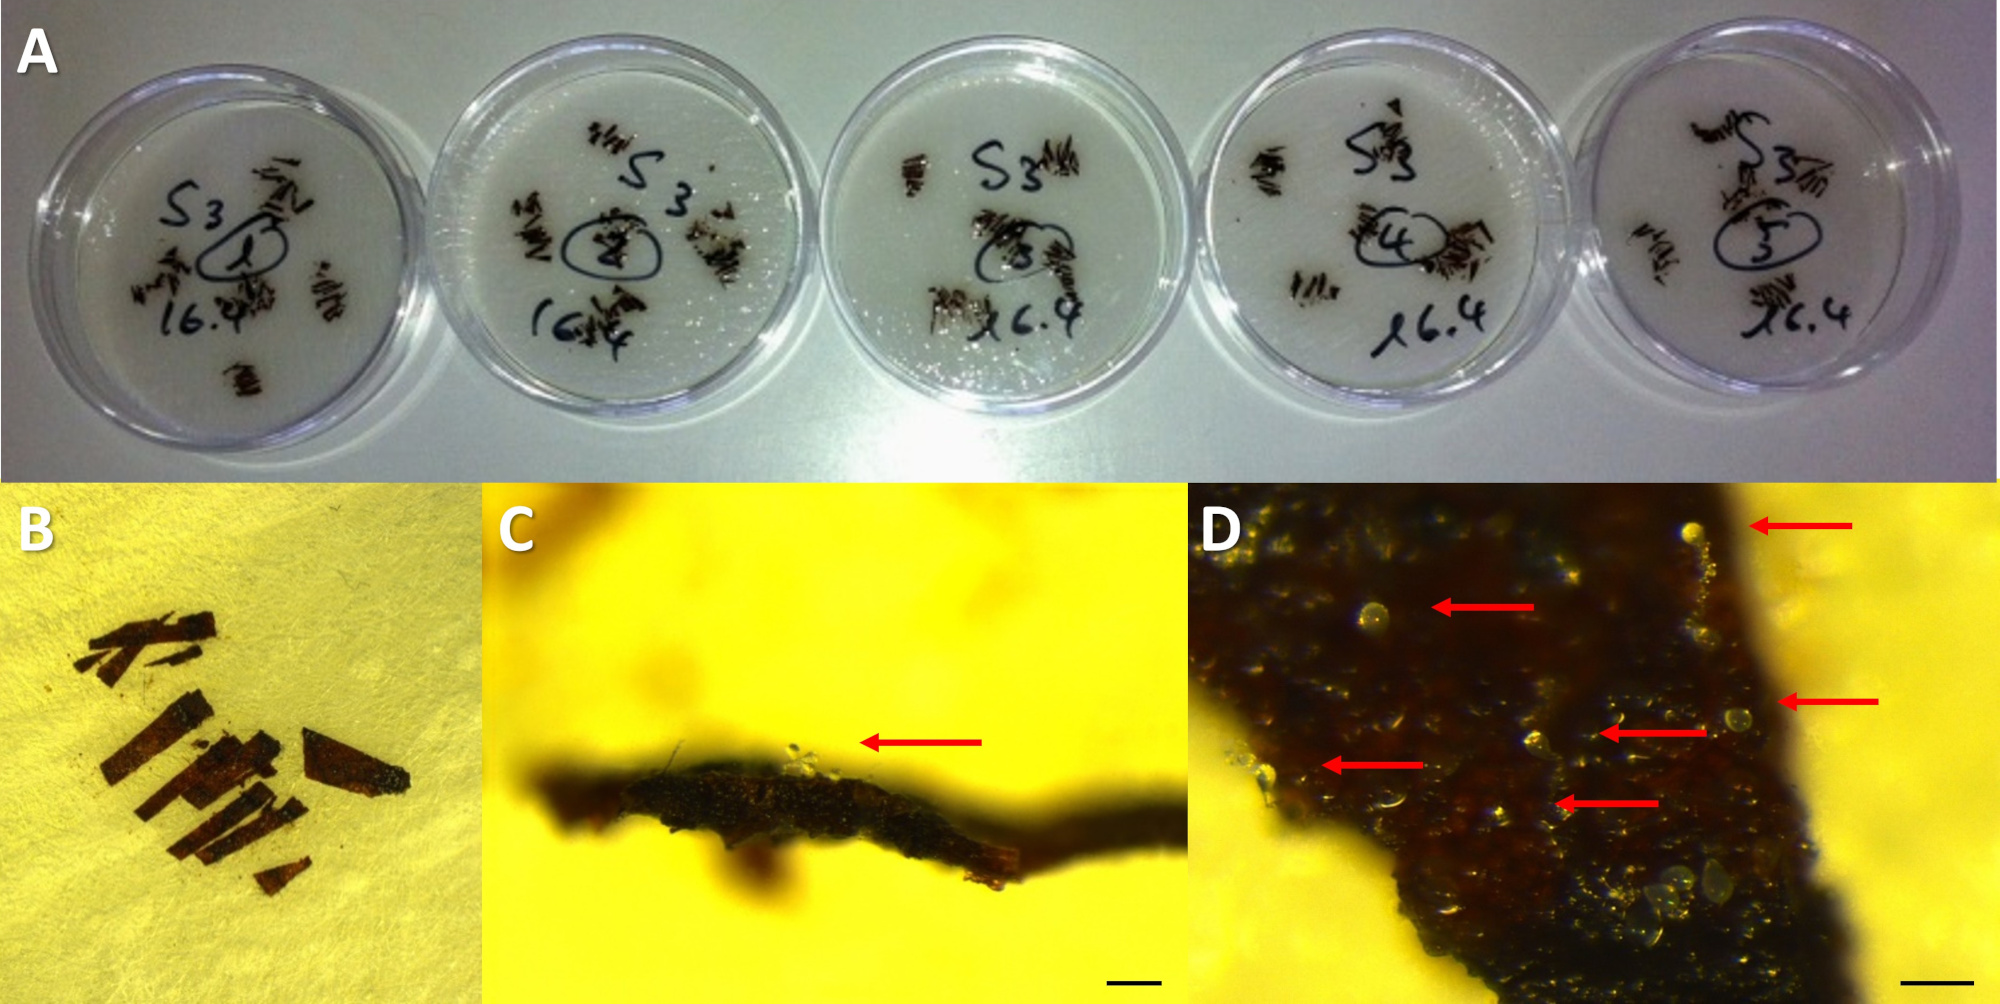
Figure 2. Preparation for oospore germination.
5. Data analysis
The MTG was compared with various meteorological data obtained from Agrometeo (www.agrometeo.ch) at Changins (Campbell weather station, 46°23'53.4" N 6°13'50.4" E). The following daily parameters were considered: average temperature at + 2 m, average relative humidity, precipitation, leaf wetness, dew point, and solar radiation. Moreover, cumulative climatic parameters were calculated over defined time intervals preceding the sampling date. These included: cumulative precipitation over the 30, 60, or 90 days prior to sampling, cumulative precipitation from 1 January and from 1 November of the previous year, the number of rainy days (defined as days with precipitation > 0 mm) in the 30 days prior to sampling, and cumulative solar energy received since 1 January. The VPD was calculated using the average temperature at + 2 m and relative humidity (Anderson, 1936). In addition to these calendar-based indicators, observed grapevine phenology was used to define ecoclimatic indicators, i.e. climatic variables interpreted within biologically meaningful phenological windows rather than only according to fixed calendar dates (Caubel et al., 2015; Holzkämper et al., 2013). In particular, BBCH 13 was used as a phenological threshold to compare climatic drivers before and from the three-leaf stage onwards.
Statistical tests were performed using R 4.6.0. Data handling and visualisation were performed using the tidyverse version 2.0.0, ggplot2 version 4.0.3, patchwork version 1.3.2, viridis version 0.6.5, scales version 1.4.0, lubridate version 1.9.5, and ggrepel version 0.9.8 packages. Correlation analyses, linear models, generalised linear models, model comparisons, and principal component analyses were performed using base R functions, including cor.test(), lm(), glm(), anova(), and prcomp(). GLM marginal plots were produced with the effects R package version 4.2.5. Statistical significance was indicated using the following thresholds: p < 0.001, p < 0.01, and p < 0.05.
To visualise the relationships between MTG and selected climatic variables, scatterplots were generated, and locally estimated scatterplot smoothing (LOESS) curves were fitted using geom_smooth(method = “loess”, se = TRUE) in ggplot2.
A generalised linear model (GLM) was fitted to predict MTG before BBCH 13 from the climatic variables most strongly associated with oospore germination. Because MTG was expressed as a discrete number of days, the model was fitted using a Poisson error distribution with a log link function. Model effects were visualised using effect plots with 95 % confidence intervals. To account for potential interannual variability, an extended model including Year (2004–2024) as a fixed factor was also fitted. Model comparison using ANOVA (for the linear model) and likelihood ratio tests (for the Poisson GLM) indicated that adding “year” did not significantly improve the model fit. Finally, the Poisson GLM was extended to include interaction terms between climatic variables and BBCH category (either before or after BBCH 13) to check for changes in effect on MTG and synergies between predictor variables and BBCH subgroups.
Results
1. Climatic drivers of oospore germination timing
Systematic monitoring of oospore germination over three years generated 60 observations, each corresponding to a minimum time to germination (MTG) value. For statistical purposes, we excluded any series in which fewer than 10 macrosporangia were observed during the 10-day observation period. Such series typically occurred in early June. After this data cleaning, 55 observations remained for analysis.
Spearman’s rank correlation analysis revealed that the oospores’ MTG was positively and significantly correlated with the mean vapour pressure deficit (VPD) and the mean temperature (p < 0.01), but also with the cumulative solar radiation over the previous 30 days and since 1 January (p < 0.05) (Figure 3A). These variables, all closely linked to temperature, were correlated in the same direction: higher temperatures, VPD, and solar radiation were associated with longer oospore germination times.
By contrast, MTG showed significant negative correlations with rainfall and humidity-related variables. The strongest negative correlations were found with cumulative precipitation and the number of rainy days in the 30 days preceding sampling (Figure 3A). Weaker but still significant negative correlations were observed with relative humidity (RH), cumulative precipitation, and number of rainy days over the 60 days preceding sampling, the daily precipitation on the sampling day and leaf wetness (Figure 3A).
To determine the consistency of these climatic drivers over time, the analysis was extended to a historical dataset encompassing 21 years of oospore germination observations. Since 2004, observations have generally been conducted shortly after rainfall events, extended up to 2–3 weeks after the maturation threshold (MTG = 1) to ensure maturity. In cases where maturity had not yet been reached, observations continued until the first week of June. The full dataset comprised 175 observations.
(A) Systematic observations (2022−2024). (B) Full observations (2004−2024). Positive correlations indicate that higher values of the variable are associated with longer germination times, while negative correlations indicate shorter germination times. Bars are ordered by correlation strength on recent observations, with statistical significance indicated as follows: *** p < 0.001; ** p < 0.01; * p < 0.05. Variables are coloured according to their climatic category (thermal, hydric, thermo-hydric, or other).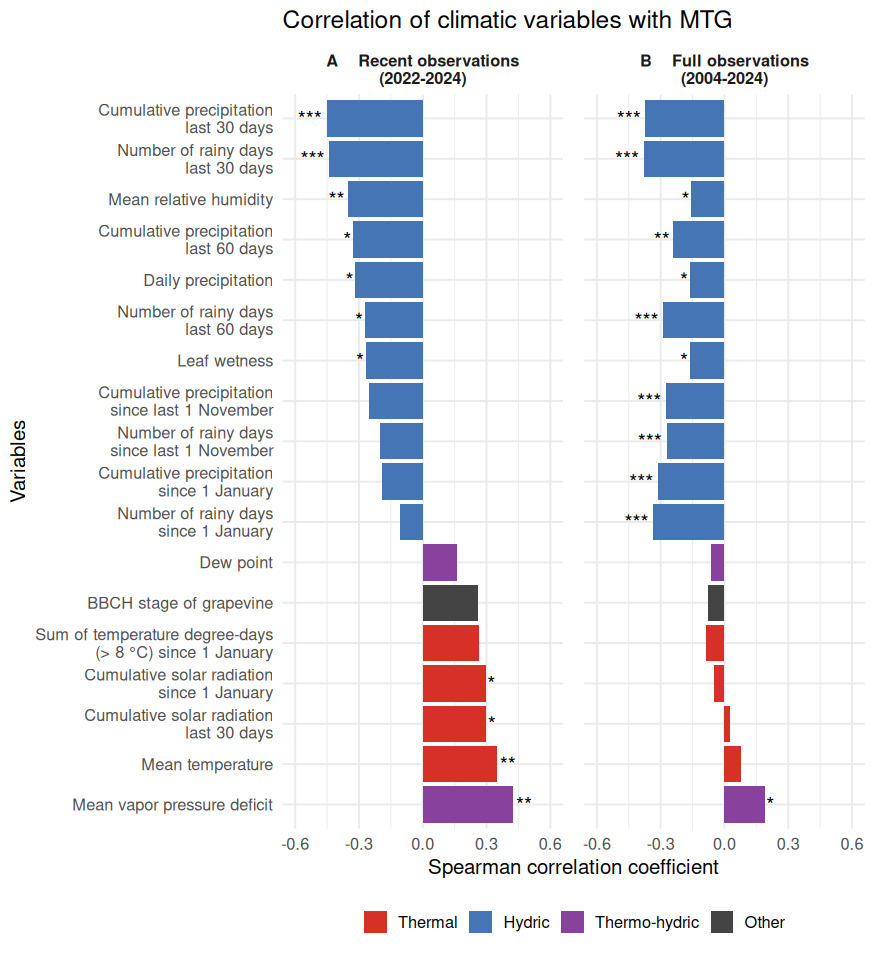
Figure 3. Spearman correlation coefficients between minimal time of germination (MTG) and climatic variables.
Given that the full dataset spans more than 20 years, a linear model that included “year” as a fixed factor was tested to assess whether interannual effects contributed to the variability in MTG. Model comparison showed that adding “year” did not significantly improve model fit. Incorporating historical observations into the dataset resulted in lower Spearman correlation coefficients (reduced ρ values), while the directionality of the relationships remained unchanged for the hydric variables (Figure 3B). In contrast to the recent observations (2022−2024), thermal variables were no longer significantly correlated with MTG.
The strongest and most significant negative correlations remained cumulative precipitation and the number of rainy days in the 30 days preceding sampling (Figure 3B). Notably, cumulative precipitation and rainy days over the previous 60 days, since 1 January, and since 1 November showed a stronger and more significant correlation in the full dataset than in the recent dataset (Figure 3).
Across all individual observations collected between 2004 and 2024, the relationships between MTG and selected climatic variables showed consistent directional tendencies, although the relationships were highly variable and non-linear (Figure 4). For cumulative TDD, MTG showed a non-monotonic relationship, with an initial decrease at low TDD values, followed by an increase beyond a threshold corresponding approximately to BBCH growth stages between 13 and 53 (Figure 4A). Relationships with precipitation-related variables were also non-linear. MTG generally tended to decrease with increasing cumulative precipitation since 1 January and with a higher number of rainy days during the preceding 30 days, although these trends followed curved rather than strictly linear patterns (Figure 4B and 4C). By contrast, MTG showed a clearer increasing tendency with VPD, with higher MTG values generally observed under drier atmospheric conditions (Figure 4D).
Panels show MTG as a function of (A) cumulative temperature degree-days (> 8 °C) since 1 January, (B) cumulative precipitation since 1 January, (C) number of rainy days during the previous 30 days, and (D) vapour pressure deficit (VPD). Each point represents an individual observation from 2004 to 2024, and colours indicate the BBCH phenological stage of the grapevine at the time of collection. Solid lines correspond to locally estimated scatterplot smoothing (LOESS), illustrating general trends between MTG and each climatic variable.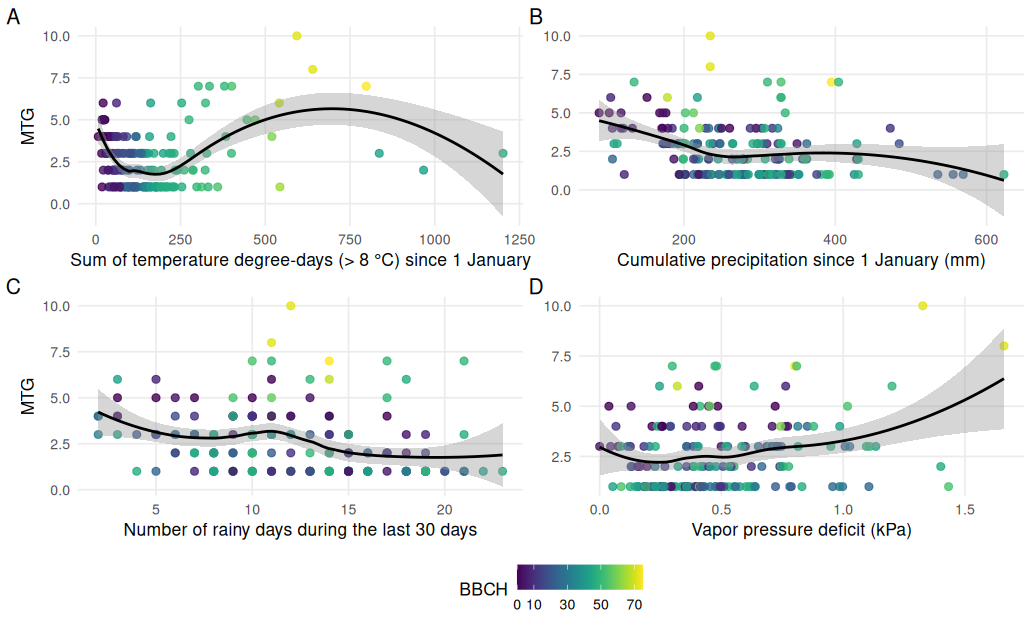
Figure 4. Relationships between oospore minimal time of germination (MTG) and selected climatic variables.
2. Phenology-related shifts in climatic drivers of oospore germination
To further investigate potential shifts in climatic drivers of oospore germination, we examined whether the grapevine phenological stage could be used as a threshold to differentiate these relationships. Based on these observations, we tested whether each BBCH stage could be used as a potential threshold by splitting the dataset into two groups separated by each stage and ensuring that the sample sizes were balanced. For each split, we calculated the Spearman’s rank correlation between MTG and variables and retained the BBCH stage that maximised the difference in correlations between the two groups. BBCH 13 emerged as the most discriminating threshold. In addition to this statistical approach, an inspection of the MTG–TDD relationship across BBCH stages (Figure 4A) revealed a clear change in the shape of the response between BBCH 10 and 53, with an initial decrease in MTG, followed by an increase as thermal accumulation progressed. This visual pattern suggested a phenology-related shift and motivated the separation of the dataset into two phases – before and from BBCH 13 onwards – to better characterise climatic controls on oospore germination.
As reported above, recent observations (n = 24) revealed strong correlations. Although the sampling was less systematic, the complete dataset (n = 96) exhibited the same trends. Before BBCH 13, rainfall-related variables, such as the number of rainy days and cumulative precipitation since 1 January, were the main drivers of oospore germination in the recent dataset (Figure 5). With ρ values of around – 0.7, rainfall parameters played a strong role during the first part of the season. The number of rainy days in the previous 30 days, since 1 January, and since 1 November, together with cumulative precipitation since 1 January, emerged as the four most strongly and significantly negative correlations.
Left panels: 2022–2024; right panels: 2004–2024. Significance: *** p < 0.001, ** p < 0.01, * p < 0.05.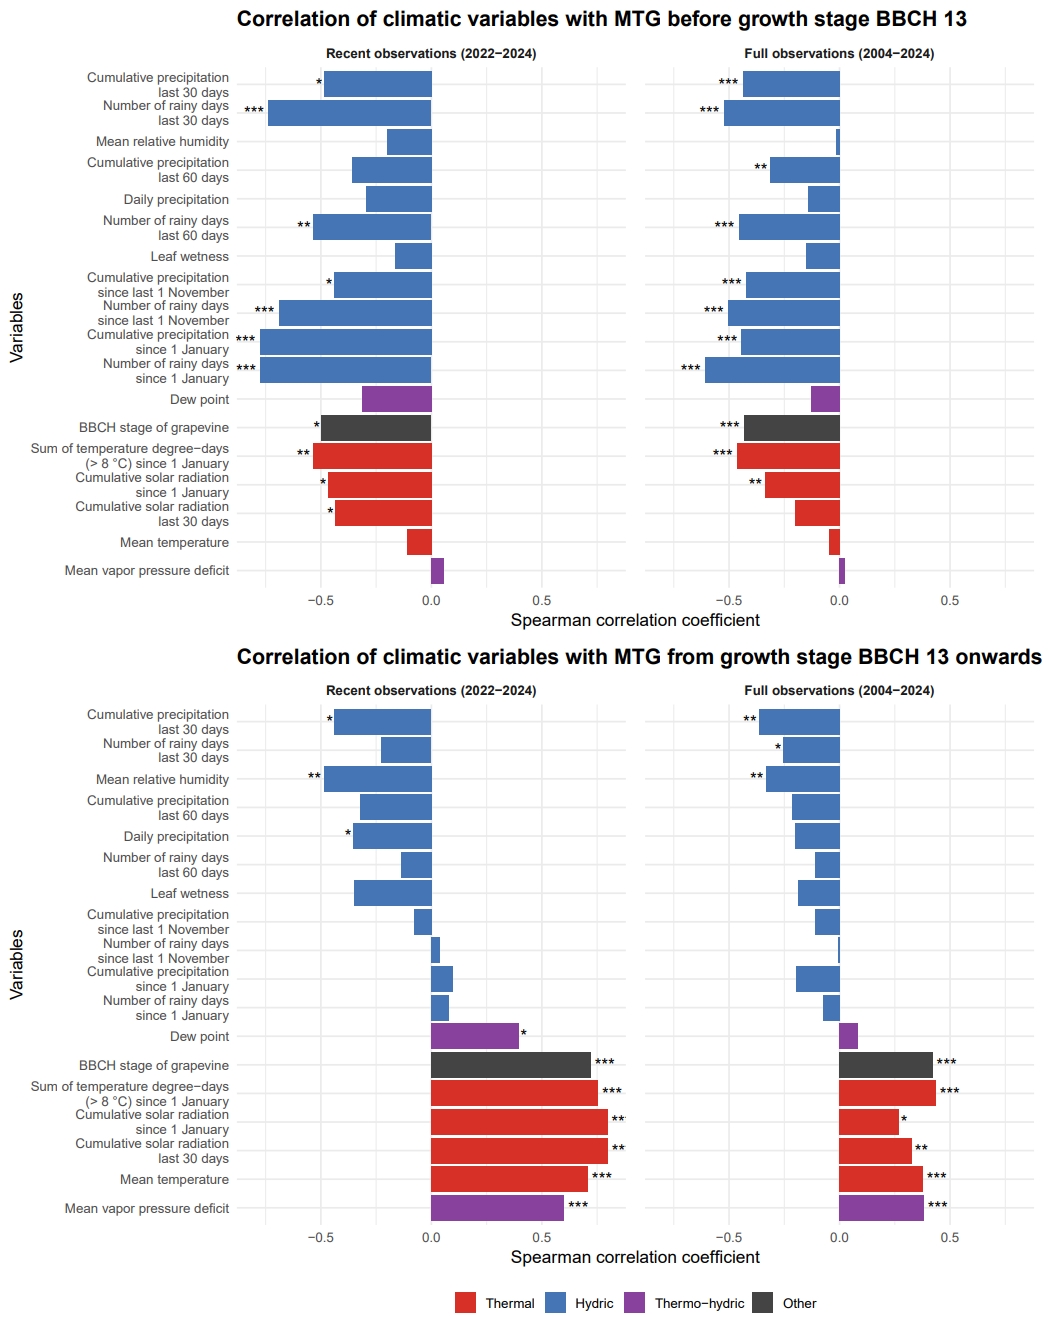
Figure 5. Spearman correlations between minimal time to germination (MTG) and climatic variables, shown for observations before (top) and from BBCH 13 onwards (bottom).
The full dataset followed the same trend, with parameters associated with rainfall also showing highly significant correlations around ρ = – 0.5. Notably, among variables not directly related to rainfall, TDD and the BBCH stage showed the strongest and most significant correlations. As these variables increased, MTG decreased, indicating that wet conditions and accumulated heat accelerated oospore maturation at this early stage.
From the growth stage BBCH 13 onwards (recent dataset: n = 31; full dataset: n = 79), precipitation showed less significant effect on oospore germination. By contrast, temperature-related variables became dominant and were strongly and significantly correlated with germination. Observations in the recent dataset showed that cumulative solar radiation over the previous 30 days and since 1 January, TDD, daily mean temperature, BBCH, and VPD displayed the strongest positive correlations with MTG (Figure 5). These results indicate that once BBCH 13 is reached, warmer conditions, higher thermal accumulation, and drier air with greater evaporative demand tend to prolong the germination time of the oospores. The full dataset displayed the same pattern, with correlations in the same direction. Among them, TDD and BBCH emerged as the most robust predictors of MTG.
A principal component analysis (PCA) was performed on the full dataset (2004−2024) separately for the periods before and from the growth stage BBCH 13 onwards to jointly assess how the relationships among climatic variables differed across grapevine phenological stages (Figure 6). The data were categorised into two groups: observed mature oospores (MTG = 1–2 days) and observed immature oospores (3–10 days). We classified MTG = 2 days as mature to avoid an overly restrictive definition, as germination may have occurred shortly after the 24-hour threshold.
Arrows represent variable loadings on the first two principal components. Points correspond to individual observations classified as mature (MTG = 1–2 days, green) or immature (MTG = 3–10 days, grey) oospores. Ellipses indicate 40 % probability regions (approximately one standard deviation) around group centroids.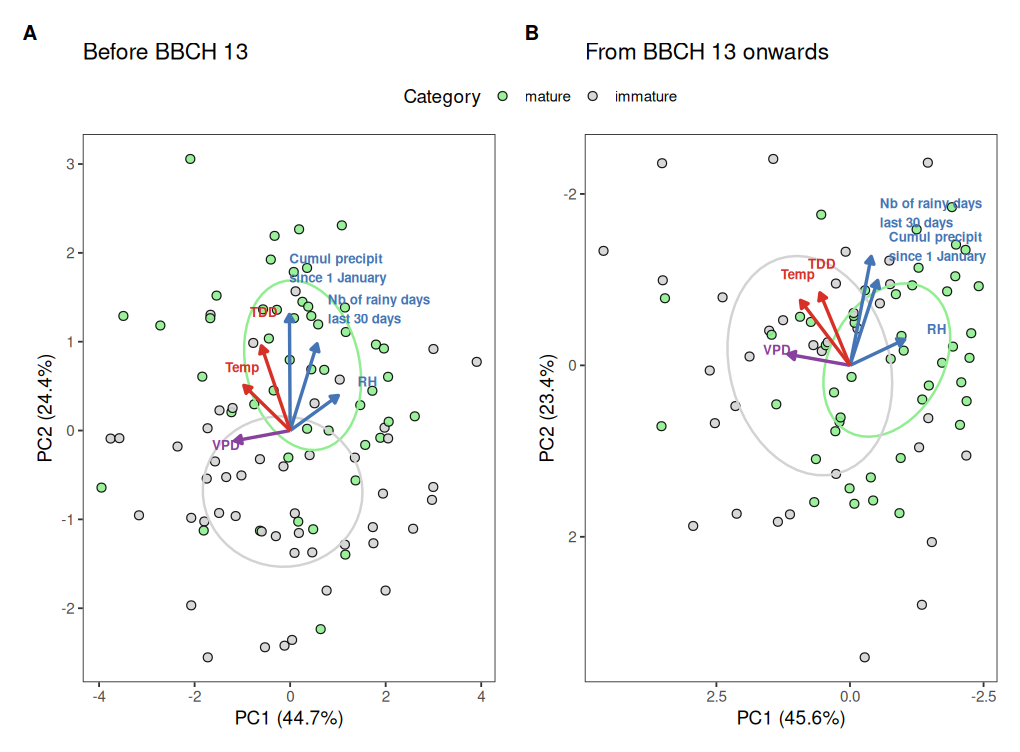
Figure 6. Principal component analysis (PCA) of climatic variables most strongly correlated with oospore maturity status before and from BBCH 13 onwards.
Before BBCH 13, the first principal component (PC1, 44.7 % of the total variance) primarily captured a moisture gradient, separating rainfall-related variables (cumulative precipitation since 1 January, number of rainy days in the last 30 days, and RH) from variables associated with drier atmospheric conditions, such as TDD, temperature, and VPD. The second component (PC2, 24.4 %) reflected a seasonal or thermal gradient, adding minor variations linked to temperature and VPD. Mature oospores were more frequently associated with wetter conditions and sufficient early-season thermal accumulation, whereas immature oospores tended to occur under drier conditions. The two 40 % confidence ellipses (approximatively one standard deviation (SD) under a normal distribution) showed partial overlap; their centroids were clearly separated along PC1, indicating a strong influence of moisture conditions on oospore maturity before BBCH 13.
From the growth stage BBCH 13 onwards, the first principal component (PC1, 45.6 % of total variance) shifted towards a thermal gradient, driven mainly by temperature, TDD, and VPD, while rainfall variables contributed negatively to the same axis. The second component (PC2, 23.4 %) captured weaker variability associated with residual humidity effects. In this phase, mature oospores were associated with lower temperature and VPD-related conditions, whereas immature oospores were aligned with higher temperature, TDD, and VPD values. Although rainfall- and humidity-related variables showed limited statistical significance in the correlation analysis after BBCH 13, their position in the PCA remained consistent with the multivariate separation between mature and immature observations. The ellipses showed greater overlap than in the early stage, but the centroid displacement remained evident along PC1, reflecting a shift in the dominant climatic drivers from hydric to thermal control.
3. GLM-based refinement of early-season oospore germination predictions
Building on these results, we developed a generalised linear model (GLM) to refine the oospore maturation stage in the VM-Plasmopara model, focusing on the early stage of the season (before BBCH 13) and using BBCH 13 as a phenological threshold. The GLM presented in Table 1 was fitted to describe MTG as a function of the three climatic variables with the strongest influence: cumulative precipitation since 1 January, number of rainy days since 1 January, and TDD.
These three predictors were selected after testing multiple combinations of climatic variables relevant to the early season, including cumulative precipitation since 1 January, number of rainy days since 1 January, TDD, cumulative solar radiation since 1 January, and VPD, considered individually and in all possible combinations. Among these tested models, the combination of cumulative precipitation, number of rainy days, and TDD consistently provided the best compromise between model fit and predictive accuracy. The final set of included predictive variables aimed to minimise the inclusion of inter-variable hypercorrelation and redundancy, without losing important biological considerations (i.e., requiring at least one representative of both temperature and precipitation). Adding further predictors did not improve model performance and, in most cases, reduced the agreement between the predicted and observed MTG values (data not shown).
Among the three chosen variables in the GLM, the number of rainy days since 1 January and TDD had negative coefficients, consistent with the correlation analysis and PCA, and showing that before BBCH 13, a higher rainfall frequency and greater accumulated thermal time were associated with shorter germination times, whereas the effect of cumulative precipitation was weaker and non-significant. Although the cumulative precipitation since 1 January was not significant in the multivariate GLM (Table 1), it was retained because it provides complementary information on the total amount of water received since the beginning of the year, while rainfall frequency describes the temporal recurrence of wet conditions. This behaviour likely reflects collinearity among rainfall-related variables; however, cumulative precipitation provides complementary information on moisture conditions and was therefore kept as a biologically meaningful hydric descriptor in the final model. Marginal effects plots (showing individual effects of each variable on the MTG prediction, while holding all other variables constant) confirmed these patterns (Figure 7). The number of rainy days and TDD had the strongest and most significant effects. Cumulative precipitation since 1 January displayed a weaker, non-significant positive trend. It showed a wider confidence interval at the lowest and highest values, reflecting greater uncertainty due to the smaller number of observations in these ranges. To further validate our observations of a switch in synergies between BBCH and climatic variables, we extended the GLM to include interaction terms between each variable and BBCH subgroups (< 13 and ≥ 13). The marginal effects plots are shown in Figure S3 and confirm that temperature degree-day and precipitation level variables contribute in opposing ways to MTG prediction depending on the BBCH subgroup (TDD:BBCH_cat, p < 0.01; cumul_precipit_1Jan:BBCH_cat, p = 0.02; nb_days_rainfall_1Jan:BBCH_cat, p < 0.001).
Variable | Estimate | Std. Error | z value | p-value |
Intercept | 2.36 | 0.27 | 8.9 | < 2 × 10⁻¹⁶ |
Cumulative precipitation since 1 January | 0.00076 | 0.00119 | 0.63 | 0.53 |
Number of rainy days since 1 January | −0.034 | 0.012 | −2.87 | 0.0041 |
Temperature degree-days (base 8 °C) since 1 January | −0.0046 | 0.002 | −2.28 | 0.023 |
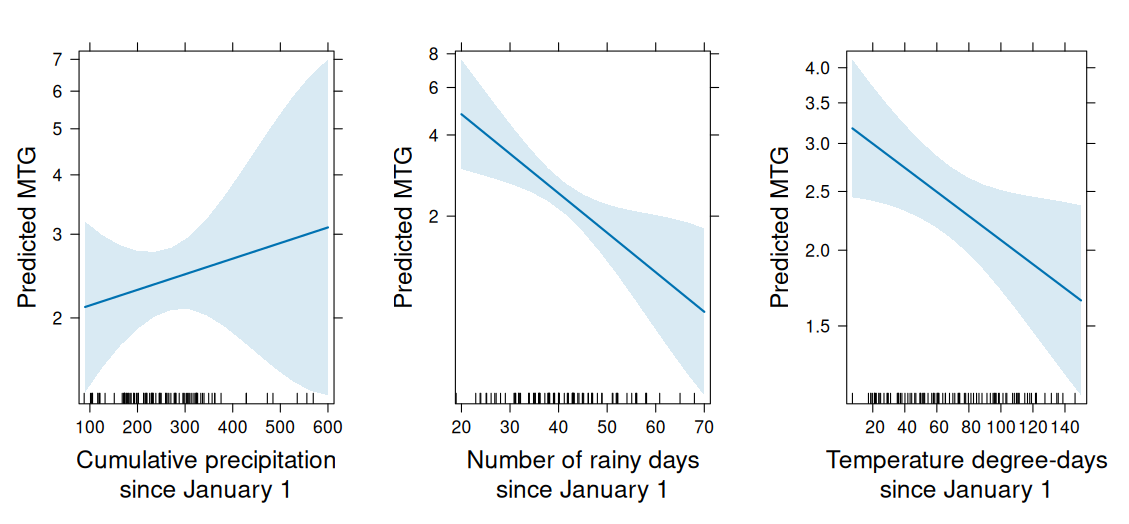
Figure 7. Marginal effects plots from the generalised linear model describing the influence of climatic variables on the minimum time to germination (MTG) before BBCH 13 (n = 96). Blue lines represent the model-predicted MTG, holding other predictors constant at their mean values, with 95 % confidence intervals shown in shaded areas.
VM-Plasmopara is a mechanistic forecasting model for downy mildew infection risk that simulates each stage of the pathogen’s life cycle (Siegfried et al., 2004). A detailed description of the complete model is available on the Agrometeo platform (www.agrometeo.ch), which includes historical archives of weather variables and predicted oospore maturity dates. To determine the date of oospore maturation, the VM-Plasmopara model relies solely on the accumulation of TDD above 8 °C starting from 1 January. When the TDD reaches the threshold of 140 °C-days, the oospores are considered mature. However, in 2009, 2013, 2016, and 2023, the model triggered the primary infection too late compared to the actual date of the first observed primary infection (Figure 8A). In 2013, 2016, and 2023, this delay occurred because the TDD threshold of 140 °C-day had not yet been reached.
In some years, VM-Plasmopara predicted primary infections substantially earlier than the observed primary infection date. In 2019 and 2020, this gap exceeded 21 days, with VM-Plasmopara predictions occurring 26 and 38 days before the observed primary infection, respectively (Figure 8A).
(A) Representation of the current forecasting framework. The purple dots indicate the calendar day when the temperature degree-day (TDD) threshold of 140 °C-day (base 8 °C) is reached, corresponding to the oospore maturity threshold used in the VM-Plasmopara model. The pink crosses represent the predicted primary infection dates generated by VM-Plasmopara, while green open circles indicate the observed primary infection dates in the field. (B) Representation of the revised forecasting framework based on the generalised linear model (GLM). The orange dots indicate the predicted oospore maturity date estimated by the GLM. The blue crosses represent the primary infection dates simulated by VM-Plasmopara using the GLM-based maturity date, and the green open circles correspond to the observed primary infection dates.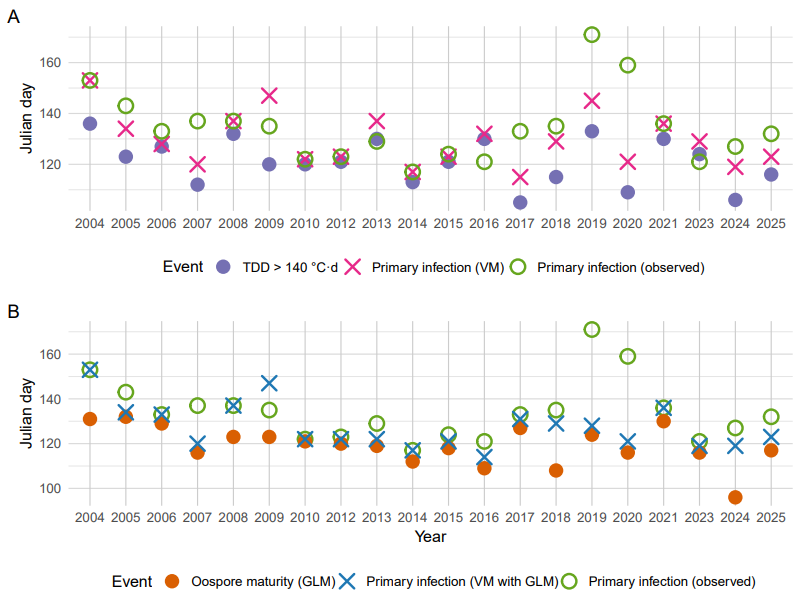
Figure 8. Julian day calendar of main downy mildew annual events (2004-2025).
To assess whether the VM-Plasmopara oospore maturity step could be improved, we applied our new GLM, based on the most explanatory climatic variables for oospore maturity, over the 2004–2025 period. The years 2011 and 2022 were excluded from Figure 8 and Tables S1 and S2 because no symptom was observed at the experimental site, preventing comparison between observed and predicted primary infection dates. The maturity threshold was initially tested at MTG = 1, corresponding to the classical definition of full maturity. However, this threshold proved too restrictive: in several years, MTG never reached 1, or did so only late in the season, which was inconsistent with field observations of primary infection timing. In practice, MTG values frequently fluctuated between 1.1 and 1.4 during much of the growing season, particularly around bud break. To obtain maturity dates that better reflected observed epidemiological dynamics, we therefore adopted a threshold of MTG < 1.5. This threshold aligns most closely with the observed maturity date, being, on average, 5 days earlier than the predicted maturity (Table S2) and closer to the primary infection observed (Figure 8). Notably, the GLM provided a maturity date that, in 13 out of 20 years, fell between the laboratory-observed maturity date and the date when the TDD 140 °C-days threshold was reached (Table S1).
Using the GLM-based maturity prediction, the three years in which the observed primary infection occurred before the fixed TDD > 140 °C-day threshold (2013, 2016, and 2023) were correctly reclassified, with predicted oospore maturity occurring before the primary infection (Figure 8B). The GLM-derived oospore maturity dates were then used as input to run the VM-Plasmopara model, replacing the fixed TDD > 140 °C-day threshold.
Under the GLM-driven configuration, the number of years in which VM-Plasmopara predicted primary infection later than observed was reduced from four (2009, 2013, 2016, and 2023) to one (2009) (Figure 8 and Table S2). Three previously mispredicted years were therefore corrected (2013, 2016, and 2023), with primary infection now predicted before or at the observed date. However, this configuration did not reduce the average anticipation window relative to the observed primary infection. On average, the current VM configuration predicted primary infection 4.9 days before observation, whereas the GLM-based version predicted it 7 days before observation (Table S2). This mean value was strongly influenced by a few extreme years, particularly one case in which the GLM-based configuration predicted primary infection 43 days before the observed event. Therefore, model timing accuracy was also assessed using the median absolute difference between predicted and observed primary infection dates. This median absolute difference decreased from 8 days with the current VM configuration to 4.5 days with the GLM-based configuration. This improvement is particularly evident in 2017, when the GLM-based approach predicted primary infection only 2 days before the observed event, compared to an 18-day anticipation with the standard VM-Plasmopara configuration. A similar improvement was observed in 2006, where the standard configuration predicted primary infection 5 days after the observed event, whereas the GLM-based configuration predicted it on the exact day of observation.
However, the GLM-based approach does not uniformly improve the timing across all years. The large prediction gaps observed in 2019 and 2020 were not reduced, reflecting their exceptional nature. The prediction gap even increased in 2019, with primary infection predicted 26 days before the observed event by the standard VM-Plasmopara configuration, compared with 43 days before observation with the GLM-based configuration. Two additional years showed a slight numerical decrease in prediction accuracy. In 2012, the GLM-based configuration predicted primary infection 1 day before the observed event, whereas the standard VM-Plasmopara configuration predicted it on the exact day of observation. Similarly, in 2015, the anticipation window increased from 1 day with the standard configuration to 3 days with the GLM-based configuration.
Discussion
1. Hydric and thermal drivers of oospore germination timing
The correlation analyses identified both hydric and thermal variables as important drivers of oospore germination timing, but their relative importance differed between the recent systematic dataset and the full dataset. In the 2022–2024 dataset, MTG was positively associated with temperature-related variables, including mean temperature, VPD, and solar radiation, indicating that warmer and drier conditions were associated with longer germination times. This result is consistent with previous studies showing that thermal conditions are involved in oospore development and germination timing, and that germination can be delayed when temperature conditions are outside the favourable range (Carisse, 2016; Gehmann et al., 1987; Hill & Bleyer, 2000; Maddalena et al., 2021; Serra & Borgo, 1995).
By contrast, rainfall- and humidity-related variables were negatively associated with MTG, indicating that higher rainfall, or more frequent rain events in the preceding month, are associated with shorter germination times. Humid conditions promote the germination of oospores, as previously reported for rainfall, liquid water availability, litter moisture, and low VPD (Caffi & Rossi, 2006; Hill, 2001; Hill & Bleyer, 2000; Maddalena et al., 2021; Rossi et al., 2002).
In the full dataset, hydric variables remained the most consistent predictors of MTG, particularly cumulative precipitation and the number of rainy days over the previous 30 and 60 days, as well as since 1 January, suggesting the importance of longer rainfall windows. This supports previous studies suggesting that oospore maturation and germination are influenced not only by short-term rainfall events, but also by longer-term moisture conditions during the previous autumn, winter, and early spring, including cumulative rainfall over several weeks to months before sampling (Caffi & Rossi, 2006; Rossi et al., 2002; Rozon-Tran Manh Sung & Clerjeau, 1987; Strizyk, 1983; Vercesi et al., 1997).
The comparison between the recent and full datasets also highlighted differences in the apparent contribution of thermal variables. According to MeteoSwiss (2025) data for Changins, the years 2022−2024 were markedly warmer and drier than the climatic norm (1991−2020), particularly during the winter and early spring period (January–May) corresponding to the period during which oospores progressively acquire maturity. The mean air temperatures were on annual average of + 2 °C in 2022, + 1.7 °C in 2023 and + 1.2 °C in 2024 above the climatic norm. Although total precipitation varies substantially from year to year and is more difficult to interpret at this scale, the consistently warmer conditions during 2022−2024 likely contributed to strengthening the temperature-related correlation in the recent dataset. Such thermal anomalies may have accelerated early-season development processes, accentuating contrasts with the more heterogeneous full dataset.
Methodological differences between the two datasets may also account for part of these discrepancies. Historical data were collected in a non-systematic way, generally after rainfall events and without a fixed sampling interval, whereas the recent series were monitored systematically throughout the season. This irregularity reduced the representation of dry periods and may have biased the estimation of climatic effects – particularly rainfall-related variables – by preferentially capturing moments when germination had already been triggered. However, taken together, these results indicate that hydric conditions represent the most robust drivers of oospore germination timing in both recent and full datasets of observations, whereas thermal effects appear more dependent on the seasonal context. This seasonal dependence therefore motivated a phenology-based analysis of climatic drivers.
2. Phenological shift around BBCH 13 and host–pathogen synchrony
The phenology-based analysis revealed a shift in the relationship between climatic variables and oospore germination timing around BBCH 13, also reflected in the non-linear relationship between TDD and MTG as thermal accumulation progressed later into the season. Together, these non-linear patterns suggest that oospore maturity is controlled by interacting thermal and hydric constraints rather than by single climatic thresholds, as previously suggested for P. viticola oospore maturation (Hill & Bleyer, 2000; Hill, 2001; Caffi & Rossi, 2006; Maddalena et al., 2021).
Although TDD has primarily been used to describe dormancy release, our results reveal a non-linear relationship between TDD and oospore germination. A minimum TDD threshold was required for oospore maturity, whereas higher TDD values were associated with a longer MTG. This two-phase pattern suggests that temperature accumulation initially promotes oospore maturation but, beyond the maturity threshold, further thermal forcing negatively affects subsequent germination. Notably, germination times tended to increase as the season progressed, with longer MTG values observed in the early summer. This observation is consistent with findings by Rozon-Tran Manh Sung and Clerjeau (1987) and Carisse (2016), who reported that the number of germinated oospores declines later in the season, as most oospores present in the samples had already germinated.
This phenology-based approach follows the rationale of ecoclimatic indicators, in which climatic variables are interpreted over biologically meaningful phenological periods rather than only over fixed calendar windows. Such approaches have been used in viticulture to assess climate effects on grapevine maturity and yield across phenological periods and cultivars (Bécart et al., 2022; Caubel et al., 2015; Massano et al., 2025), and more recently in grapevine pathology for esca disease, showing that climate–disease relationships can vary among dormancy, active growth, and esca symptom-expression phases (Etienne et al., 2026). Applying this framework to P. viticola may help to interpret oospore germination dynamics, because maturation and germination are expected to be synchronised with both environmental conditions and host development. In downy mildew, Rozon-Tran Manh Sung and Clerjeau (1987) described a two-phase maturation and germination process. Similarly, a phenological synchronicity at BBCH 11 was observed by Maddalena et al. (2021). More broadly, the recent development of fungal phenology frameworks, such as PhenoFun, highlights the relevance of describing plant pathogen life-cycle events in relation to both environmental drivers and host-plant phenology, as a complement to plant-centred phenological scales such as BBCH (Delmas et al., 2024).
The identification of BBCH 13 as the most discriminating threshold supports the use of host phenology as a biologically meaningful boundary for interpreting climatic effects on oospore germination, rather than relying exclusively on fixed calendar periods or cumulative thermal thresholds (Caubel et al., 2015). Although the BBCH stage and TDD are closely linked, they are not interchangeable. TDD describes cumulative thermal forcing, while BBCH represents the phenological state of the host plant, which integrates not only temperature but also developmental constraints, seasonal timing, and other biological processes governing vine development. For a host-specific pathogen, such as P. viticola, grapevine phenology provides a biologically meaningful framework for interpreting shifts in oospore germination processes.
Before BBCH 13, the correlation analysis showed that rainfall-related variables and TDD were associated with shorter MTG. This interpretation is consistent with the PCA, in which mature oospores were more frequently associated with wetter conditions and sufficient early-season thermal accumulation. From BBCH 13 onwards, temperature-related variables became more strongly associated with MTG, suggesting that once the early moisture-dependent phase is complete, germination timing is increasingly shaped by seasonal progression and atmospheric dryness (Caffi & Rossi, 2006; Maddalena et al., 2021).
Overall, the correlation analysis and PCAs indicated a shift from rainfall and humidity as the dominant controls before BBCH 13 to temperature-related factors as vegetation growth progresses, highlighting the relevance of phenology-based ecoclimatic indicators for interpreting climate–pathogen relationships in grapevine systems (Caubel et al., 2015; Etienne et al., 2026; Massano et al., 2025). Whereas rainfall and humidity dominate the early phase, favouring the completion of oospore maturation, thermal and evaporative factors become more decisive once the vine reaches the three-leaf stage, in agreement with previous studies showing that both water availability and temperature regulate oospore maturation and germination in P. viticola (Caffi & Rossi, 2006; Hill & Bleyer, 2000; Rozon-Tran Manh Sung & Clerjeau, 1987; Vercesi et al., 1997).
Oospore maturation and germination processes can therefore occur before the emergence of susceptible host tissues, reflecting the acquisition of infective potential in the early phenological stages. This phenological synchrony may ensure that the pathogen becomes infective as the grapevine exits dormancy and as soon as susceptible tissues become available (Maddalena et al., 2021; Rozon-Tran Manh Sung & Clerjeau, 1987).
3. Implications of the GLM-based maturity prediction for VM-Plasmopara
In viticulture, the primary infection of P. viticola marks a critical turning point, as it is an important event in determining the start of phytosanitary treatments. This study therefore focused on the early epidemic phase, as the timing of oospore maturity and germination directly influences the prediction of soil-borne primary infections and, consequently, disease control decisions.
Swiss winegrowers currently rely on the VitiMeteo-Plasmopara model to schedule fungicide treatments, with oospore maturation estimated solely from temperature. However, the model does not account for humidity, despite its known importance for oospore maturation and germination (Caffi & Rossi, 2006; Gilles, 2004; Hill & Bleyer, 2000; Martínez-Bracero et al., 2020; Vercesi et al., 1997). In this context, experimentally observed oospore maturity under controlled laboratory conditions provides a relevant reference for evaluating the biological validity of the 140 °C-day threshold.
Over 20 years, four late predictions highlight the limitation of a fixed thermal threshold for representing oospore maturity, particularly when hydric conditions may accelerate maturation despite relatively low TDD. Consequently, temperature-based predictions of primary infections deviated markedly from observations. Predictions were up to 12 days too late in 2009, 2013, 2016, and 2023, with the highest delay observed in 2009, whereas they were 9 to 38 days too early in 2007, 2017, 2019, 2020, and 2025. In the latter case, this potentially triggered fungicide applications more than three weeks before the actual risk period. In 2019 and 2020, primary infections occurred on 20 June 2019 (Julian day 171) and 7 June 2020 (Julian day 159), dates that are exceptionally late under Swiss viticultural conditions (Table S1). Such delays are likely linked to atypical spring conditions, combining unusually warm temperatures with limited and sporadic rainfall events, potentially reducing effective zoospore release despite early climatic suitability. These two seasons therefore represent atypical epidemic dynamics where primary infection timing is likely constrained by biological processes not fully captured by the current framework.
The climatic parameters identified as key drivers before BBCH 13 were incorporated into a GLM that integrated hydric factors in addition to the TDD, resulting in a biologically more representative model. By adopting a slightly higher threshold (MTG < 1.5), our model also captures situations in which most oospores are mature and ready to germinate, even if the mean MTG has not yet reached exactly 1 day, thus ensuring better interannual representativeness and reducing the risk of missing primary infection events.
When integrated into VM-Plasmopara, the GLM-based maturity prediction improved the accuracy of primary infection forecasts in 5 out of 20 years either by shifting delayed predictions to dates occurring before or on the observed primary infection date (2013, 2016, 2023), or by reducing the anticipation window when predictions were already earlier than the observed event (2006, 2017). The GLM-based maturity prediction integrated into VM-Plasmopara also resulted in identical predictions in 12 years, while deteriorating predictions in only 3 years (2012, 2015, 2019), only one of which was agronomically relevant (2019). Consequently, the number of years in which the standard VM-Plasmopara model predicted primary infection later than observed decreased from 4 out of 20 years (20 %) to 1 out of 20 years (5 %). The median absolute difference between predicted and observed primary infection dates decreased with the GLM-based configuration, indicating that the GLM-driven approach improved the typical prediction accuracy despite a higher mean anticipation. Such an improvement could translate into the avoidance of one to two unnecessary fungicide applications under typical spray programs. However, the GLM-based approach did not uniformly improve prediction timing across all years. In rare cases, under certain climatic configurations, the GLM-based oospore maturity model predicted one to two days earlier than the TDD-based threshold, as seen in 2012 and 2015. These differences in timing remained minor and are therefore unlikely to be agronomically relevant in practical disease management. Taken together, these results support the integration of a climate-driven maturity model into VM-Plasmopara to improve the biological consistency of oospore maturity timing and reduce both delayed triggers (risk underestimation) and overly early warnings (risk overestimation). By providing more balanced risk windows across most seasons, the GLM-based approach could improve vineyard monitoring efficiency and support more sustainable disease management. However, its remaining discrepancies highlight the need to account for additional factors beyond temperature and rainfall that may influence epidemic onset.
4. Limitations, transferability, and future improvements
Several limitations should be considered when interpreting the proposed GLM-based maturity prediction. First, discrepancies between predicted and observed primary infection dates may partly arise from inaccuracies in modelling oospore maturity, which propagate through subsequent infection predictions but may also reflect observational limitations. Indeed, the number of grapevine leaves that can be monitored under outdoor laboratory conditions is limited, as is the spatial extent of the experimental vineyard plots; hence, rare or spatially localised primary infection events may remain undetected.
In addition, extrapolating oospore maturation from experimental tubes to vineyard soils involves several assumptions. A key advantage of the tube system is that it allows the recovery and monitoring of infected leaf debris, which becomes inaccessible once incorporated into soil. In vineyard soils, oospores are embedded within decomposing leaf litter and the upper soil layers, where they experience highly heterogeneous moisture, temperature, microbial activity, decomposition, and soil structure (Viret & Gindro, 2025). The tube system standardised exposure conditions while preserving the plant debris matrix, thereby reducing the spatial and biological complexity of the soil litter interface but providing an operational framework for assessing oospore germination capacity under semi-controlled field conditions. The results should therefore be interpreted as an operational estimate of oospore germination ability, rather than as a direct representation of a full range of soil processes occurring in vineyards.
The second limitation comes from the novel approach of structuring the dataset according to grapevine phenology. Maddalena et al. (2021) previously demonstrated synchrony between grapevine receptivity and oospore germination in spring. Synchrony is a well-documented concept in host–pathogen systems, whereby an obligate pathogen aligns its life cycle with that of its host. Our results identified BBCH 13 as a transition point in P. viticola germination. Cultivar-specific differences could not be assessed in this study because phenological observations were based exclusively on cv. Chasselas. Although inter-cultivar differences in phenology are generally relatively limited during early developmental stages, future studies should determine whether similar phenology-based thresholds apply across cultivars, as cultivar-specific phenological variation may influence the interpretation of ecoclimatic indicators in grapevine systems (Etienne et al., 2026; Massano et al., 2025).
The transferability of the model to other climatic contexts should also be evaluated. The integration of recent and long-term data revealed a predominant role for hydric variables, such as cumulative precipitation over 30 or 60 days and since 1 January, as well as the number of rainy days in the preceding month. These results are consistent with the findings of Vercesi et al. (2000), who reported a positive correlation between oospore germination and the means of daily temperature and precipitation over the preceding 40, 50, and 60 days. By contrast, our analysis revealed weaker correlations with cumulative precipitation since 1 November of the previous year, suggesting limited influence from autumn rainfall, contrary to the hypothesis proposed by Strizyk (1983). The strong association with VPD, which depends on both relative humidity and temperature, is consistent with its use in the UCSC model by Rossi et al. (2005), further supporting its biological relevance. Among the thermal variables studied, TDD was the only one consistently identified as a significant predictor across both recent and full datasets, supporting its use in VM-Plasmopara (Siegfried et al., 2004) and its relevance, as reported by Carisse (2016). However, because the GLM was developed from observations collected in Changins, Switzerland, its transferability to other winegrowing regions should be considered with caution. The relative importance of hydric and thermal variables may vary among regions, seasons, and vineyard systems, while variables included in the model, such as cumulative precipitation, rainfall frequency, TDD, and VPD, are strongly influenced by local climatic conditions, vineyard structure, and phenological timing. Independent validation across contrasting climatic conditions, cultivars, and local P. viticola populations is therefore required before broader implementation.
Overall, we acknowledge the potential risk of biased performance estimates of our predictive models. These were built from our selection of climatic variables specific to and dependent on weather data at Changins. To increase the transferability and predictive reach of our models, further studies under different conditions and experimental sites are needed.
Complementary molecular approaches could help overcome part of the limitations associated with indirect assessment of oospore maturity. Quantitative polymerase chain reaction (qPCR), droplet digital PCR (ddPCR), or loop-mediated isothermal amplification (LAMP)-based approaches could be used to quantify P. viticola DNA in leaf debris, soil, or air samples and thereby provide a more direct estimate of inoculum presence (Carisse et al., 2021; Douillet et al., 2022; Fedele et al., 2025; Poeydebat et al., 2025; Si Ammour et al., 2020). In particular, ddPCR has recently been used to quantify P. viticola oospores in vineyard soil and revealed a spatially heterogeneous primary inoculum reservoir at the field scale (Poeydebat et al., 2025). Similarly, qPCR-based quantification of P. viticola DNA in leaf litter was shown to be strongly correlated with microscopic oospore counts and with subsequent primary infection pressure (Fedele et al., 2025). However, molecular detection alone does not distinguish between viable, dormant, mature, or non-viable oospores, nor does it directly measure germination ability (Fedele et al., 2025; Poeydebat et al., 2025). For this reason, combining molecular quantification with functional germination assays would likely provide the most informative framework for linking inoculum availability, oospore maturity, and primary infection risk. Future developments should therefore combine multi-site validation, cultivar-specific phenological observations, functional germination assays, and molecular inoculum quantification to refine oospore maturity prediction and improve the portability of the model across winegrowing regions.
Conclusion
Overall, the GLM-based oospore maturity model improved the consistency of VM-Plasmopara primary infection forecasts over two decades of data compared with the current TDD-based maturity threshold. By integrating both hydric and thermal variables, the model provided a more biologically representative estimate of oospore maturity and reduced delayed early-season predictions. Validation under diverse climatic conditions, in other winegrowing regions, across cultivars, and with local pathogen populations will be essential to confirming the broader applicability of the oospore maturity prediction GLM model, while accessing larger-scale data may ultimately allow for a more precise hyperparametrisation approach using dedicated machine-learning algorithms. Improved integration of laboratory observations and modelling could, after several years of validation, also simplify the monitoring of P. viticola by focusing observations during the most informative periods. Furthermore, this oospore maturity prediction GLM could serve as a template for Swiss and European winegrowing regions, providing a practical tool to identify when oospores reach maturity, thereby improving disease control efficiency.
Acknowledgements
The authors gratefully acknowledge the technical staff of Agroscope Changins for their invaluable assistance with field sampling and laboratory observations, as well as the winegrowers who provided access to their vineyards for oospore collection. We also thank the Agrometeo team for supplying historical climate data and the VitiMeteo team for supplying the VM-Plasmopara model data. This work was financially supported by the Swiss National Science Foundation (SNSF) as part of the BRIDGE Discovery programme (grant no. 40B2-0_194747 / 1, SMALA).
References
- Anderson, D. B. (1936). Relative Humidity or Vapor Pressure Deficit. Ecology, 17(2), 277–282. https://doi.org/10.2307/1931468
- Baldacci, E. (1947). Epifitie di Plasmopara viticola (1941–46) nell´Oltrepó Pavese ed adozione del calendario di incubazione come strumento di lotta. Atti Istituto Botanico, Laboratorio Crittogamico, 8, 45–85.
- Bécart, V., Lacroix, R., Puech, C., & García De Cortázar-Atauri, I. (2022). Assessment of changes in Grenache grapevine maturity in a Mediterranean context over the last half-century. OENO One, 56(1). https://oeno-one.eu/article/view/4727
- Burkardt, J., & Hill, G. K. (1997). Studies on the epidemiological impact of oospore content in vineyard soils. Viticultural and Enological Science, 52, 136–137.
- Caffi, T., & Rossi, V. (2006). Water availability in the leaf litter and germination of Plasmopara viticola oospores. Proceedings of the Fifth International Workshop on Grapevine Downy and Powdery Mildew, 33–34.
- Carisse, O. (2016). Development of grape downy mildew (Plasmopara viticola) under northern viticulture conditions: Influence of fall disease incidence. European Journal of Plant Pathology, 144(4), 773–783. https://doi.org/10.1007/s10658-015-0748-y
- Carisse, O., Van der Heyden, H., Tremblay, D. M., Hébert, P. O., & Delmotte, F. (2021). Evidence for Differences in the Temporal Progress of Plasmopara viticola Clades riparia and aestivalis Airborne Inoculum Monitored in Vineyards in Eastern Canada Using a Specific Multiplex Quantitative PCR Assay. Plant Disease, 105(6), 1666–1676. https://doi.org/10.1094/PDIS-06-20-1164-RE
- Caubel, J., García De Cortázar-Atauri, I., Launay, M., De Noblet-Ducoudré, N., Huard, F., Bertuzzi, P., & Graux, A.-I. (2015). Broadening the scope for ecoclimatic indicators to assess crop climate suitability according to ecophysiological, technical and quality criteria. Agricultural and Forest Meteorology, 207, 94–106. https://doi.org/10.1016/j.agrformet.2015.02.005
- Cortesi, P., & Zerbetto, F. (1994). Dynamics of oospore maturation of Plasmopara viticola in northern Italy. Proceedings of the First International Workshop on Grapevine Downy Mildew Modeling, 26–30 August 1991, Geneva, NY, USA, 55–73.
- Delmas, C. E. L., Bancal, M., Leyronas, C., Robin, M., Vidal, T., & Launay, M. (2024). Monitoring the phenology of plant pathogenic fungi: Why and how?. Biological Reviews, 99(3), 1075–1084. https://doi.org/10.1111/brv.13058
- Douillet, A., Laurent, B., Beslay, J., Massot, M., Raynal, M., & Delmotte, F. (2022). LAMP for in-field quantitative assessments of airborne grapevine downy mildew inoculum. Journal of Applied Microbiology, 133(6), 3404–3412. https://doi.org/10.1111/jam.15762
- Etienne, L., Martinetti, D., Frank, E., Bonnardot, V., Michel, L., Guérin-Dubrana, L., & Delmas, C. E. L. (2026). Identification of Ecoclimatic Indicators of Esca Disease Through 20 Years of Large-Scale Vineyard Monitoring in France. Plant Disease, 110(4), 1258–1269. https://doi.org/10.1094/PDIS-01-25-0228-RE
- Fedele, G., Maddalena, G., Furiosi, M., Rossi, V., Toffolatti, S. L., & Caffi, T. (2025). Relationship between the oospore dose in the leaf litter above the vineyard ground and primary infections by Plasmopara viticola. Frontiers in Plant Science, 16, 1524959. https://doi.org/10.3389/fpls.2025.1524959
- Gehmann, K., Staudt, G., & Grossmann, F. (1987). Der Einfluss der Temperatur auf die Oosporenbildung von Plasmopara viticola / The influence of temperature on oospore formation of Plasmopara viticola. Zeitschrift Für Pflanzenkrankheiten Und Pflanzenschutz / Journal of Plant Diseases and Protection, 94(3), 230–234.
- Gessler, C., Pertot, I., & Perazzolli, M. (2011). Plasmopara viticola: A review of knowledge on downy mildew of grapevine and effective disease management. Phytopathologia Mediterranea, 50(1), Article 1. https://doi.org/10.14601/Phytopathol_Mediterr-9360
- Gilles, T. (2004). Forecasting Downy Mildew Diseases. In P. Spencer-Phillips & M. Jeger (Eds), Advances in Downy Mildew Research—Volume 2 (pp. 35–67). Springer Netherlands. https://doi.org/10.1007/978-1-4020-2658-4_2
- Hill, G. K. (2000). Simulation of Plasmopara viticola oospore maturation with the model SIMPO. IOBC/WPRS Bulletin, 23, 7–9.
- Hill, G. K. (2001). The survival of Plasmopara viticola macrosporangia under various moisture conditions. IOBC/WPRS Bulletin, 24, 33–35.
- Hill, G. K., & Bleyer, G. (2000). Studies on the influence of ambiant vapour pressure deficit and rainfall on the germination of mature and immature oospores of Plasmopara viticola. Proceedings of the Third International Workshop on Grapevine Downy and Powdery Mildew, SARDI, 43–44.
- Holzkämper, A., Calanca, P., & Fuhrer, J. (2013). Identifying climatic limitations to grain maize yield potentials using a suitability evaluation approach. Agricultural and Forest Meteorology, 168, 149–159. https://doi.org/10.1016/j.agrformet.2012.09.004
- Maddalena, G., Russo, G., & Toffolatti, S. L. (2021). The Study of the Germination Dynamics of Plasmopara viticola Oospores Highlights the Presence of Phenotypic Synchrony With the Host. Frontiers in Microbiology, 12, 698586. https://doi.org/10.3389/fmicb.2021.698586
- Martínez-Bracero, M., González-Fernández, E., Wójcik, M., Alcázar, P., Fernández-González, M., Kasprzyk, I., Rodríguez-Rajo, F. J., & Galán, C. (2020). Airborne fungal phytopathological spore assessment in three European vineyards from different bioclimatic areas. Aerobiologia, 36(4), 715–729. https://doi.org/10.1007/s10453-020-09664-6
- Massano, L. T., Bois, B., Adrian, M., Fosser, G., & Gaetani, M. (2025). The Use of Ecoclimatic Indices to Investigate Climate Impact on Wine Grape Yield at Local Scale. SSRN. https://doi.org/10.2139/ssrn.5114313
- Park, E. W., Seem, R. C., Gadoury, D. M., & Pearson, R. C. (1997). DMCAST: A prediction model for grape downy mildew development. Viticultural and Enological Science, 52, 182–189.
- Peng, J., Wang, X., Wang, H., Li, X., Zhang, Q., Wang, M., & Yan, J. (2024). Advances in understanding grapevine downy mildew: From pathogen infection to disease management. Molecular Plant Pathology, 25(1), e13401. https://doi.org/10.1111/mpp.13401
- Poeydebat, C., Courchinoux, E., Mazet, I. D., Rodriguez, M., Chataigner, A., Lelièvre, M., Goutouly, J.-P., Rossi, J.-P., Raynal, M., Delière, L., & Delmotte, F. (2025). Digital droplet PCR quantification and field-scale spatial distribution of Plasmopara viticola oospores in vineyard soil. Applied and Environmental Microbiology, 91(12), e01667-25. https://doi.org/10.1128/aem.01667-25
- Rossi, V., & Caffi, T. (2012). The role of rain in dispersal of the primary inoculum of Plasmopara viticola. Phytopathology, 102(2), 158–165. https://doi.org/10.1094/PHYTO-08-11-0223
- Rossi, V., Caffi, T., Giosuè, S., Girometta, B., Bugiani, R., Spanna, F., Dellavalle, D., Brunelli, A., & Collina, M. (2005). Elaboration and validation of a dynamic model for primary infections of plasmopara viticola in north italy. Rivista Italiana di Agrometeorologia, 3, 7-13.
- Rossi, V., Giosuè, S., Girometta, B., & Bugiani, R. (2002). Influenza delle condizioni meteorologiche sulle infezioni primarie di Plasmopara viticola in Emilia-Romagna. ATTI Giornate Fitopatologiche, (2), 263–270.
- Rouzet, J., & Jacquin, D. (2003). Development of overwintering oospores of Plasmopara viticola and severity of primary foci in relation to climate. EPPO Bulletin, 33(3), 437–442. https://doi.org/10.1111/j.1365-2338.2003.00670.x
- Rozon-Tran Manh Sung, C., & Clerjeau, M. (1987). Influence des conditions climatiques en automne sur la maturation des oospores de Plasmopara viticola et sur la gravité des attaques de Mildiou au printemps: Modélisation du phénomène. Proceedings of the EC Experts’ Group, Thessaloniki ed. R. Cavalloro, 237–243.
- Rozon-Tran Manh Sung, C., & Clerjeau, M. (1988). Prévoir la gravité des attaques de mildiou dès l’hiver: Une fiction devenue réalité. Phytoma – Défense des Cultures, 396, 40–41.
- Serra, S., & Borgo, M. (1995). Investigations on maturation and germination of Plasmopara viticola oospores overwintered in natural conditions [Veneto]. Petria (Italy), 5(2), 91–104.
- Si Ammour, M., Bove, F., Toffolatti, S. L., & Rossi, V. (2020). A Real-Time PCR Assay for the Quantification of Plasmopara viticola Oospores in Grapevine Leaves. Frontiers in Plant Science, 11, 1202. https://doi.org/10.3389/fpls.2020.01202
- Siegfried, W., Viret, O., Bloesch, B., Bleyer, G., & Kassemeyer, H.-H. (2004). ‘Vitimeteo Plasmopara’—Ein neues Prognosemodell für den Falschen Rebenmehltau. Schweizerische Zeitschrift Für Obst- Und Weinbau, 140(23), 10.
- Strizyk, S. (1983). Modèle d’état potentiel d’infection: Application à Plasmopara viticola. Association de Coordination Technique Agricole, Maison Nationale Des Eleveurs, 1–46.
- Toffolatti, S. L., Russo, G., Campia, P., Bianco, P. A., Borsa, P., Coatti, M., Torriani, S. F., & Sierotzki, H. (2018). A time-course investigation of resistance to the carboxylic acid amide mandipropamid in field populations of Plasmopara viticola treated with anti-resistance strategies. Pest Management Science, 74(12), 2822–2834. https://doi.org/10.1002/ps.5072
- Vercesi, A., Sirtori, C., Cortesi, P., Serra, S., Setti, E., & Liberati, D. (1997). Effect of temperature and rainfall on germination dynamics of Plasmopara viticola oospores. Viticultural and Enological Science, 52(3), 165–166.
- Vercesi, A., Sirtori, C., Vavassori, A., Setti, E., & Liberati, D. (2000). Estimating germinability of Plasmopara viticola oospores by means of neural networks. Medical & Biological Engineering & Computing, 38(1), 109–112. https://doi.org/10.1007/BF02344698
- Vercesi, A., Tornaghi, R., Sant, S., Burruano, S., & Faoro, F. (1999). A cytological and ultrastructural study on the maturation and germination of oospores of Plasmopara viticola from overwintering vine leaves. Mycological Research, 103(2), 193–202. https://doi.org/10.1017/S095375629800700X
- Viret, O., & Gindro, K. (2025). Science of Fungi in Grapevine. Springer International Publishing. https://doi.org/10.1007/978-3-031-68663-4
- Weber, M. (1986). Etude de la germination des œufs d’hiver. Rapport Général Vigne. Service de La Protection Des Végétaux, Paris(FR).
- Wong, F. P., Burr, H. N., & Wilcox, W. F. (2001). Heterothallism in Plasmopara viticola. Plant Pathology, 50(4), 427–432. https://doi.org/10.1046/j.1365-3059.2001.00573.x
 Views: 282
 XML: 24